Buckling Mode Diagram (λ)
Linear Buckling Analysis: the critical load factor of the whole structure and the shape it wants to fail in
Buckling is the failure mode that gives no warning: a compressed member is straight and quiet at 99% of its critical load, and sideways at 101%. The λ diagram answers the global version of that question — by what factor could the applied loads grow before the structure as a whole becomes unstable, and what shape does the instability take?
1. From Euler to the Eigenvalue Problem
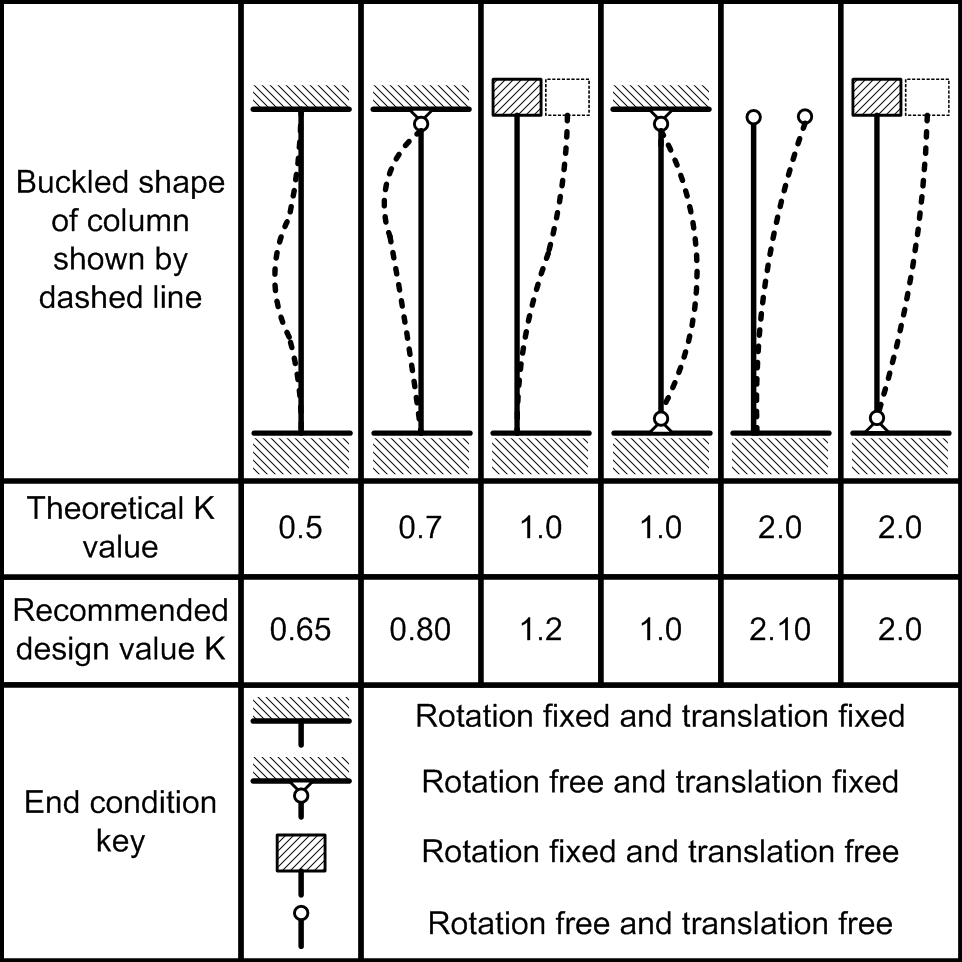
Euler solved the single column in 1744: the critical load depends on stiffness and on the square of the effective length — halve the free length and the capacity quadruples. Boundary conditions enter through the K factor:
A frame is a system of many such members loaded together, so the question becomes matricial. The Linear Buckling Analysis (LBA) solves the generalized eigenvalue problem:
K is the elastic stiffness of the structure; Kg is the geometric stiffness assembled from the axial forces N of the current analysis; λ is the critical load factor — the multiplier on the applied loads at which the structure loses stability — and φ is the buckling mode, the shape of that instability.
Below the critical load the column holds its shape; at the critical load the straight configuration stops being stable and the mode shape takes over.
How CalcSteel colors the λ button: comfortable margin (green), tight margin (amber), unstable at current loads (red).
2. The λ Button in CalcSteel
When the analysis produces valid buckling modes (the model must have bars carrying compression), the λ button appears in the diagram panel, already colored by the verdict. Clicking it overlays the critical mode shape on the structure — colors show the intensity of the modal displacement. The mode shape has no units and no amplitude of its own; it is a shape, not a prediction of displacement.
Reading λcr
- λcr > 1.5 — the structure has a comfortable global stability margin at the current loads.
- 1.0 < λcr ≤ 1.5 — close to the limit. If loads can grow — more equipment, more snow, a future mezzanine — consider stiffening or bracing.
- λcr ≤ 1.0 — the applied load already meets or exceeds the critical load of the structure. Rework the bracing or the compressed members before anything else.
The shape is as valuable as the number: it points at the weakest kinematic chain. A mode that sways a whole frame asks for bracing; a mode that bows one chord asks for a stouter profile or an intermediate restraint on that chord.
3. LBA Is a Diagnosis, Not a Design Check
The eigenvalue λcr is a theoretical ceiling: it assumes perfect geometry, centered loads and elastic material. Real members carry residual stresses and are never perfectly straight, so real structures buckle below the LBA prediction — which is why design standards wrap buckling in reduction curves calibrated on thousands of tests. Treat the two tools as complementary:
| LBA (λ diagram) | Per-bar norm checks | |
|---|---|---|
| Scope | global — how the whole structure tips | local — each member with its Lk |
| Imperfections | ignored (theoretical ceiling) | built into the buckling curves |
| Use it to | find weak kinematic chains, validate bracing schemes | approve each member per NBR/AISC/EN |
- NBR 8800 — Compression (section 5.3) — the χ reduction curve that turns Euler into a design value.
- AISC 360 — Compression (chapter E) — flexural, torsional and flexural-torsional buckling of members.
- Axial force page — the N field is the input of the LBA: no compression, no buckling problem to solve.