Bending Moment Diagrams (Mz / My)
Reading and using bending moment diagrams in CalcSteel — strong axis (Mz) and weak axis (My)
The bending moment diagram is the single most consulted result in beam design. It shows, point by point along each bar, the internal moment that the cross-section must resist in flexure. Peaks reveal the critical sections — where the profile works hardest and where the flexure design checks will govern.
1. What the Moment Diagram Tells You
A positive (sagging) moment stretches the bottom fibers and compresses the top ones — the classic simply-supported beam shape. A negative (hogging) moment does the opposite, which is what happens over the supports of continuous beams and at the fixed end of cantilevers. The moment diagram is tied to the shear diagram by differentiation:
Two practical consequences: the moment peaks exactly where the shear crosses zero, and under a uniform load the diagram is always a parabola. Memorize the three canonical shapes below — they are the sanity check for almost every model:
Simply supported + uniform load: parabola, peak wL²/8 at mid-span
Central point load: triangle, peak PL/4 under the load
Cantilever + uniform load: hogging parabola, peak wL²/2 at the fixed end
Which side is the diagram drawn on?
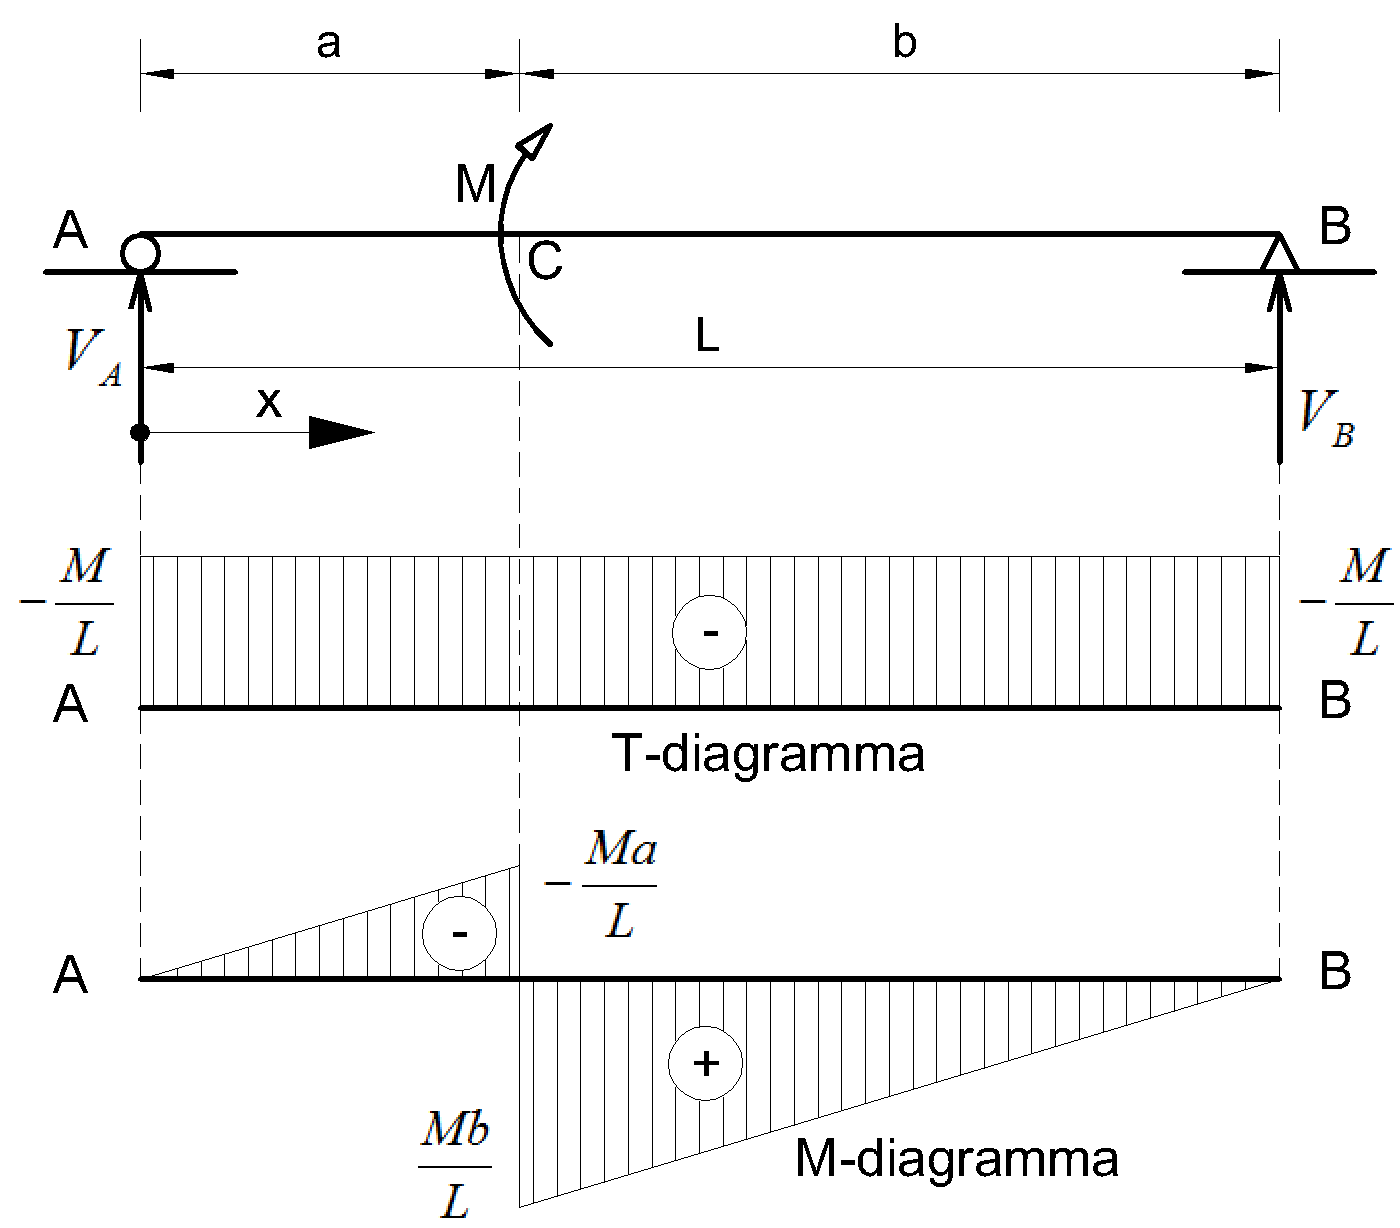
There are two schools. The European/Brazilian school draws the moment on the tension side of the bar; the US/UK school usually draws positive moments on the compression side. CalcSteel follows the tension-side convention: a sagging moment is plotted below the beam (tension at the bottom), and hogging moments over supports plot upward. If a diagram looks "flipped" compared to a textbook, check which convention that book uses.
| Case | Location | |
|---|---|---|
| Simply supported, uniform load w | mid-span | |
| Simply supported, central point load P | under the load | |
| Cantilever, uniform load w | fixed end (hogging) | |
| Fixed-fixed, uniform load w | at the supports (wL²/24 at mid-span) |
2. Mz and My in CalcSteel
Every bar has local axes: Mz is the moment about the strong axis (the natural bending of a beam under gravity loads) and My is the moment about the weak axis. After the first analysis CalcSteel activates the Mz diagram automatically — it is almost always the one you want first. Internally each bar is evaluated at 21 stations, so peaks between nodes (like the mid-span of a loaded beam) are captured, not just end values.
Where everything lives
- F → Mz / My — the Forces button in the diagram panel opens a popover with N, Vy, Mz and My. Mz is plotted in the strong-axis plane, My in the weak-axis plane.
- value pill — the peak value of each bar is shown in a dark pill at the exact peak location, in kN·m (or kip·ft in imperial units). It keeps a constant screen size regardless of zoom.
- scale slider — the vertical slider tunes the drawing amplitude from 0.1× to 10× (log scale). At 1× the largest value in the model maps to at most 1.5 m or 30% of the bar length, whichever is smaller. This is visual only — numbers never change.
- K — the Probe tool: click any point of a bar to read the exact interpolated Mz, My, N, Vy and Vz at that position, plus displacements. Ideal for checking a wL²/8 value by hand.
- Orig / ENV / CB… — tabs below the combinations table switch the active result: a single case, a specific combination, or the envelope of all combinations (worst case per point).
For design, always look at the ENV (envelope) moment before sizing a beam: a load case that looks harmless alone can govern in combination with wind or live load. The envelope shows the critical value at each of the 21 stations across all combinations.
3. From the Diagram to the Design Check
The moment diagram feeds the flexure design checks directly. The peak Mz (or My) of the governing combination is compared against the design bending resistance of the section, which depends on section compactness and on the lateral bracing of the compression flange:
- NBR 8800 — Flexure (section 5.4) — plastification, lateral-torsional buckling (FLT) and local buckling (FLM/FLA).
- AISC 360 — Flexure (chapter F) — the equivalent American checks, including the Cb modification factor.
- Combined forces — when Mz and My act together with axial force (biaxial bending in columns), the interaction equation governs.
Sanity checklist
- Simply supported beam with uniform load → probe the mid-span and compare against wL²/8. Deviations mean unintended end fixity or load input errors.
- Continuous beams and frames → expect hogging peaks over intermediate supports and at rigid joints; those sections often govern, not the span.
- A jump in the moment diagram means an applied nodal moment; a kink means a point load. If you see neither, the geometry or releases may be wrong.
- Check My whenever there are lateral loads (wind on façades, crane surge) — a profile comfortable in Mz can fail in weak-axis bending with a fraction of the moment.