Shear Force & Bending Moment Diagrams: Beam to Frame
Master shear force and bending moment diagrams — from a simply supported beam to a full portal frame — with worked examples and a free live calculator.
Key takeaways
- Two relations govern every diagram: dV/dx = -w and dM/dx = V, so the slope of one diagram is the height of the next.
- The maximum moment isn't always at V = 0 - also check fixed supports and any applied concentrated moment, then take the largest magnitude.
- Overhangs and continuous beams add hogging (negative) moment that puts the TOP fibre in tension over the support, and that flange usually needs bracing.
- Rigid frames redistribute moment: a 12 m rafter peaks near 149 kN·m as a portal frame versus 216 kN·m as a simple beam of the same span.
- The diagram is the start of design: M_max sets the required section modulus (W >= M / f_yd), and the section class decides plastic Z vs elastic W_el.
From a simple beam to a full portal frame
In 1638, sketching in the margins of his Two New Sciences, Galileo Galilei drew a stone cantilever snapping off a wall and asked a question nobody had answered before: how much load can a beam carry before it breaks? He got the arithmetic wrong — he assumed the whole section failed in tension at once — but he asked the right question, and nearly four centuries of structural mechanics have been refining the answer ever since. The tools he was missing are the two diagrams this guide is about.
A shear force diagram and a bending moment diagram are how engineers see the invisible: the internal forces travelling through a beam, a rafter, or a whole steel frame under load. Read them correctly and you know exactly where a member is working hardest and how big it needs to be. Read them wrong and you either waste steel or, worse, undersize the one section that matters.
This is meant to be the definitive walkthrough, and it takes you the whole distance — from a single simply-supported beam all the way to a full rigid portal frame, the kind of steel building you would actually design. Along the way there is a live calculator you can drive yourself, and every worked number here was produced by the CalcSteel finite-element engine and checked against textbook theory to three decimals.
We wrote it for three readers at once. If you are a student, treat it as the chapter your course compresses into two lectures. If you are a practising engineer, skip to the continuous beam and portal-frame examples, where hand methods run out of road and software takes over. And if you are simply curious how a warehouse frame really behaves, follow the story — it ends with a real one.
The CalcSteel shear & moment calculator is free, runs in your browser with no login for the math, and draws every diagram in this article as you read it.

What a shear & moment diagram actually is
A shear force diagram plots the internal transverse force that one part of a beam pushes on the next, and a bending moment diagram plots the internal couple that resists bending — both along the beam's length. You obtain them by making an imaginary cut in the beam at a section and asking what force and what moment the material must carry to keep each cut piece in equilibrium.
That is the whole idea in one paragraph. The shear V is the up-or-down force trying to slice the beam vertically at a section. The moment M is the rotational effect trying to bend it. Neither is visible from outside — you reveal them by making a cut, exposing the internal forces, and balancing what is left.
Once you have V and M as functions of position x, plotting them gives the two diagrams. The shear diagram tells you where the vertical force peaks (a web and connection concern); the moment diagram tells you where bending peaks (the section that governs the whole design).
The reason the two diagrams are always drawn together is that they are not independent — they are locked to each other by two simple relations between load, shear and moment. We state them precisely in the sign-convention section below, but the teaser is this: the slope of one diagram is the height of the next. Get that idea and you can sketch either diagram from the other without a single integral.
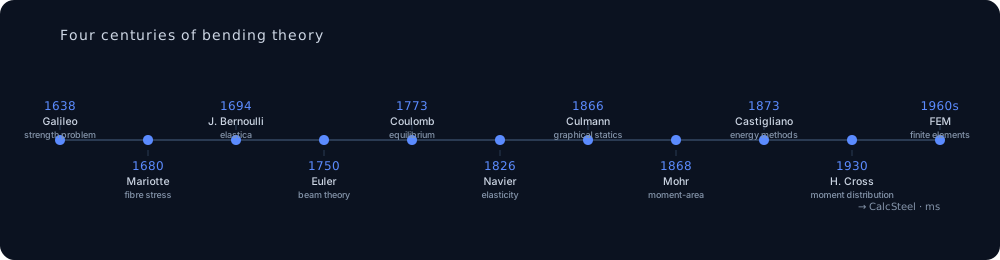
Where this method came from (400 years)
The diagrams feel timeless, but almost every idea in them has a date and a name. It took roughly four centuries to get from Galileo's broken cantilever to a solver that draws a portal frame in milliseconds.
- 1638 — Galileo Galilei poses the strength-of-beams problem in Two New Sciences. His cantilever answer is wrong, but the question launches the whole field.
- ~1680 — Edme Mariotte corrects the stress distribution across a section, recognising that fibres stretch and compress by different amounts (published posthumously in 1686).
- 1694 — Jacob Bernoulli analyses the elastica, relating a beam's curvature to the bending moment.
- ~1750 — Euler and Daniel Bernoulli formalise beam-bending theory — the Euler–Bernoulli beam still taught today.
- 1773 — Charles-Augustin de Coulomb puts the internal-force analysis on rigorous equilibrium footing.
- 1826 — Claude-Louis Navier publishes the first coherent theory of elasticity for structures, tying stress to the moment through the section.
- 1866 — Karl Culmann develops graphical statics, letting engineers draw force and moment diagrams directly.
- 1868 — Otto Mohr introduces the moment-area method, a geometric shortcut for deflections from the moment diagram.
- 1873 — Carlo Alberto Castigliano gives his energy theorems, the key to indeterminate structures by hand.
- 1930 — Hardy Cross publishes moment distribution, which finally makes continuous beams and frames solvable with pencil and patience.
- 1950s–60s — matrix structural analysis and the finite element method turn all of it into linear algebra a computer can execute.
Today that entire lineage runs the moment you press a button. When the CalcSteel calculator draws a diagram, it is compressing 400 years of mechanics into a few milliseconds — and it is free.
Sign convention & the two governing relations
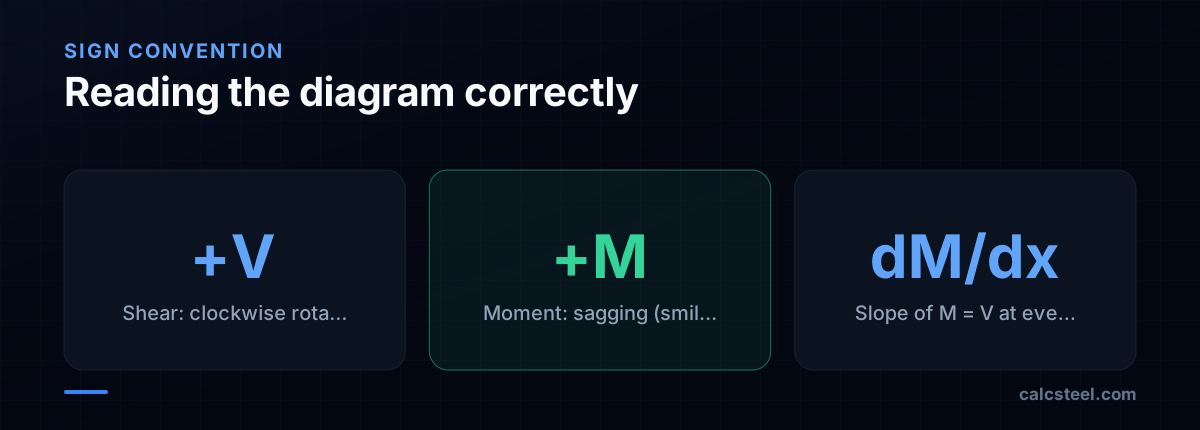
Before drawing anything you must fix a sign convention and never let go of it. Throughout this guide we use the standard structural convention: sagging is positive. A positive moment bends the beam concave-up (a smile), putting the bottom fibre in tension; a negative — hogging — moment bends it concave-down, putting the top fibre in tension. Positive shear is the force couple that tends to rotate the cut element clockwise.
Which convention you choose matters far less than using it consistently from the first cut to the last. Pick sagging-positive, keep it, and your diagrams will always agree with each other.
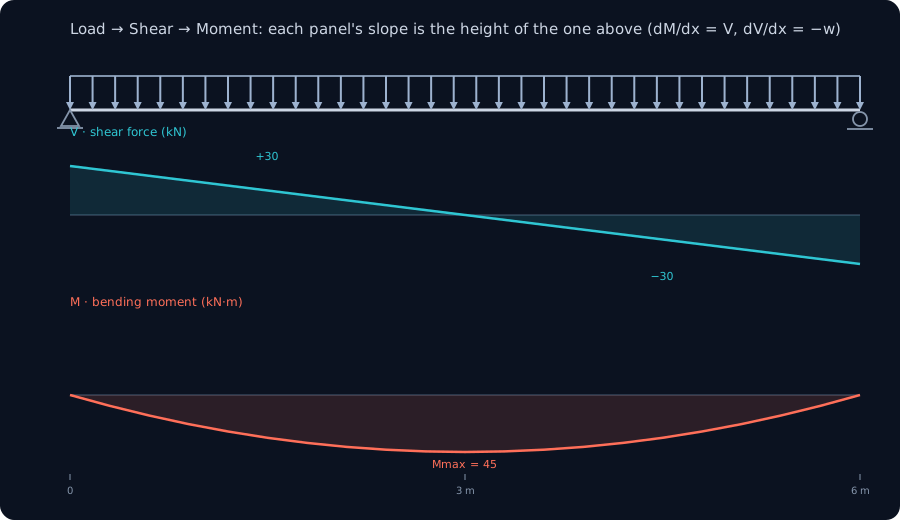
Now the two relations that make the whole method work. For a distributed load w (downward positive) along the beam:
- dV/dx = −w — the slope of the shear diagram at any point equals the negative of the load there. No load means flat shear; a uniform load means shear falls at a constant rate.
- dM/dx = V — the slope of the moment diagram equals the shear there. This is the one to memorise as a picture: the slope of one diagram is the height of the next.
Two consequences fall straight out. First, because dM/dx = V, the moment reaches an extremum exactly where the shear crosses zero — the single most useful fact for finding Mmax inside a span. Second, the change in moment between two points equals the area under the shear diagram between them (ΔM = ∫V dx), which is the fastest hand-check there is.
Here is the canonical five-step recipe that draws any statically determinate diagram:
- Find the reactions. Apply ΣFy = 0 and ΣM = 0 to the whole beam and solve for every support reaction.
- Build the shear diagram left to right. Start at zero, jump up by each upward reaction, jump down by each point load, and slope by −w under distributed load.
- Mark where shear crosses zero. Those crossings — plus fixed supports and any applied concentrated moments — are your candidate Mmax locations.
- Build the moment diagram by integrating the shear. Constant shear gives a straight ramp; linear shear gives a parabola; a concentrated moment makes M jump.
- Check equilibrium. Shear must close to zero at the far end, and the moment must return to zero at any simple support. If it doesn't, a reaction is wrong.
Every worked example that follows uses exactly these five steps — and so does the calculator, just faster.
Worked example 1: simply-supported beam, point load
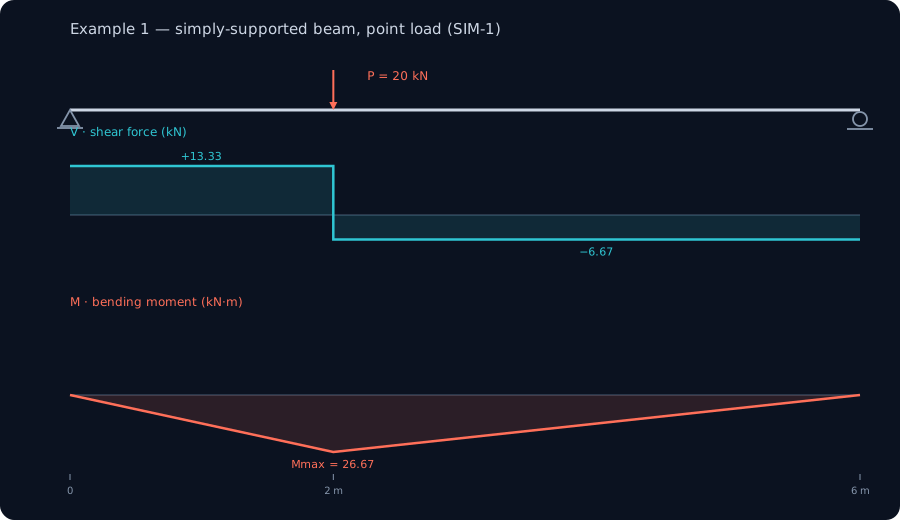
Let's put the theory to work on the simplest problem that still teaches everything: a simply-supported beam, span L = 6 m, carrying a single point load P = 20 kN applied at a = 2 m from the left support (so b = 4 m from the right). Pin at A, roller at B. Follow the five steps from the previous section and you can draw both diagrams by hand in under a minute.
Step 1 — Reactions
Take moments about A to isolate R_B: R_B = P·a/L = 20 × 2 / 6 = 6.67 kN. Then vertical equilibrium gives R_A = P − R_B = 20 − 6.67 = 13.33 kN. As a sanity check, the larger reaction sits under the support closer to the load, exactly as intuition demands.
Step 2 — Shear diagram (the steps)
Start at the left end and walk right. The shear jumps up to +13.33 kN at A and stays flat — there is no distributed load, so dV/dx = −w = 0 and the shear is constant. At x = 2 m the 20 kN point load drops the shear instantly by 20 kN, from +13.33 to −6.67 kN. It holds that value to B, where the reaction of 6.67 kN closes the diagram back to zero. That closure is your equilibrium check.
Step 3 — Moment diagram (the triangle)
Because dM/dx = V, the moment is the running area under the shear. Over the first 2 m the shear is a constant +13.33 kN, so the moment climbs as a straight line to a peak directly under the load. The area is 13.33 × 2 = 26.67 kN·m. Past the load the shear is negative, so the moment falls linearly back to zero at B. The BMD is a single triangle peaking under the point load — the classic signature of a concentrated force.
Step 4 — Where and how big is M_max?
The peak sits exactly where the shear crosses zero, at x = 2 m, and its value is the textbook closed form M_max = P·a·b/L = 20 × 2 × 4 / 6 = 26.67 kN·m. Nothing here needs a computer — but it is the perfect calibration case. When we ran this beam through the CalcSteel FEM engine, it returned R_A = 13.33 kN, R_B = 6.67 kN, V_max = 13.33 kN and M_max = 26.67 kN·m at x = 2 m: an exact match with theory to three decimals. If the engine can nail the case you can check by hand, you can trust it on the cases you can't.
Want the reactions for a different geometry first? Our free beam reaction calculator handles step 1, and the bending moment primer expands on why M_max = Pab/L.
Worked example 2: distributed load + overhang
Real beams rarely stop at their supports. Add an overhang and the moment diagram gains a second personality: hogging. Consider a beam running from x = 0 to x = 7 m with supports at x = 0 (A) and x = 5 m (B) — leaving a 2 m overhang cantilevering past B — under a uniform load w = 10 kN/m across the whole length.
Step 1 — Reactions
Total load is 10 × 7 = 70 kN, acting at the centroid x = 3.5 m. Moments about A give R_B = 49 kN; vertical equilibrium then leaves R_A = 70 − 49 = 21 kN, with R_B = 49 kN. Notice how the overhang loads up support B far beyond its "fair share" — that heavy reaction is the overhang's signature.
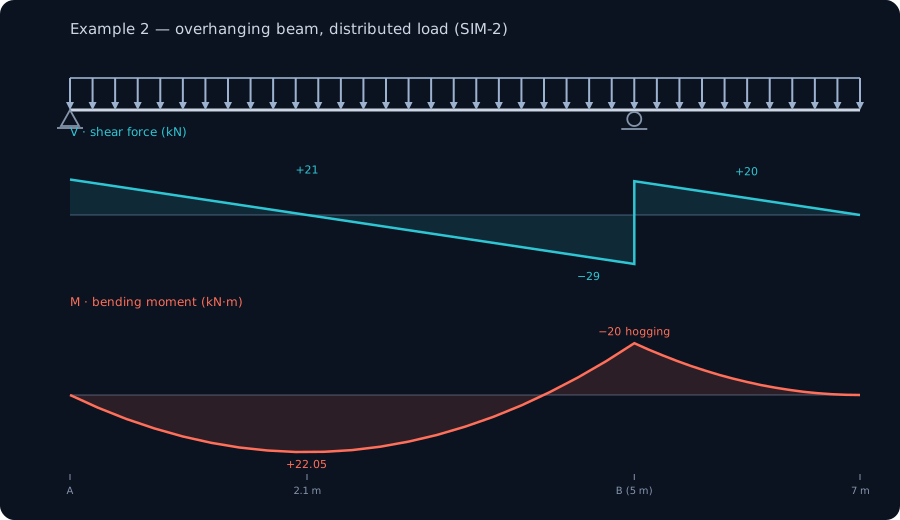
Step 2 — Shear diagram (now a slope)
With a uniform load, dV/dx = −w, so the shear is no longer flat — it ramps down at 10 kN per metre. Start at +21 kN at A and it falls linearly, crossing zero at x = 2.1 m (21 / 10 = 2.1). It keeps dropping to −29 kN just left of B, where the 49 kN reaction kicks it up to +20 kN, then ramps back down across the overhang to close at zero at the free tip. Two things matter here: the interior zero-crossing at 2.1 m, and the jump at B.
Step 3 — Moment diagram (two curvatures)
Integrating the shear now gives parabolic arcs, because the shear itself is linear. In the main span the moment rises, peaks where the shear crosses zero, then turns down and goes negative over support B. That negative value is hogging: the overhang's weight pries the beam upward over the support, putting the top fibre in tension — the opposite of the mid-span sagging you saw in example 1.
Step 4 — The two peaks that size the beam
The sagging peak sits at the shear zero-crossing, x = 2.1 m, at M = 22.05 kN·m. The hogging peak sits over support B at M = −20 kN·m. A designer must check both: the sagging peak governs the bottom flange at mid-span, the hogging peak governs the top flange over the support (and often the lateral bracing there). The CalcSteel engine reproduced all of it — R_A = 21 kN, R_B = 49 kN, shear zero at x = 2.1 m, sagging M_max = 22.05 kN·m, hogging −20 kN·m over B — straight from the load and geometry.
This is also the example that dismantles a common myth. The maximum magnitude here is the 22.05 kN·m sagging peak at x = 2.1 m, not the −20 kN·m hogging over B — the two peaks live in different places for different reasons. We unpack exactly where M_max hides in the next-but-one section.
Draw your own: the live calculator
You've now seen the method twice by hand. The fastest way to make it stick is to change the numbers and watch the diagrams respond — so here it is, live, embedded right on this page.
Drag the load, move the supports, switch between a point load and a uniform load, and the shear and bending moment diagrams redraw instantly. Try recreating example 1 (P = 20 kN at 2 m on a 6 m span) and confirm the 26.67 kN·m peak for yourself, then push the load toward mid-span and watch M_max climb. Every value you saw above is one you can now reproduce and interrogate.
It's the real thing, not a teaser: unlimited runs, completely free, and no login required for the math. If it opens in its own tab, here's the direct link to the shear and moment diagram calculator. When you're ready for a full member — reactions, deflection and section sizing together — the free beam calculator takes the next step.
Play with the determinate cases here, because in the sections that follow the beams stop being solvable by hand — a continuous beam and then a full portal frame — and that's where the CalcSteel browser-native FEM engine earns its keep.
|V| max
30 kN
@ x = 6 m
M max (sagging)
45 kN·m
@ x = 3 m
M min (hogging)
-0 kN·m
@ x = 6 m
Reactions (kN)
R_A 30 · R_B 30
Simply supported beam — uniformly distributed load
Segment equations — x in m, from the left end
0 m ≤ x ≤ 6 m
V(x) = 30 − 10·x [kN]
M(x) = 30·x − 5·x² [kN·m]
Profiles that resist this moment
Md = 45 kN·m → required Wx = Md / (fy/γa1) = 45 kN·m / (250/1.1) = 198 cm³
Bending screen (Wx ≥ Md/(fy/γa1), NBR 8800 γa1 = 1.10 — AISC 360 φb = 0.90 is nearly identical); plastic Zx is valid for compact sections only. δ is the elastic deflection of THIS loading with E = 200 GPa and the section's Ix (loads taken at service value). LTB, shear, compactness and code deflection limits are verified on the profile page and in the 3D editor. "Open in 3D editor" recreates THIS beam — span, supports and every load — with the profile already assigned.
Reading the diagram: Mmax and points of contraflexure
Once the two diagrams are drawn, the whole point is to read them: to find the single number that will size the beam and the places where the beam changes its mind about which face is in tension.
The most common rule of thumb — "the maximum moment is where the shear crosses zero" — is true, but only within a span. The complete, correct statement is this: the maximum bending moment occurs at one of three places, and you must check all of them.
- Where the shear crosses zero inside a span. Because dM/dx = V, the moment has a horizontal tangent (a local peak) exactly where V = 0. This is the classic sagging peak of a simply supported beam.
- At a fixed support. A built-in end carries a hogging moment even though the shear there is generally not zero. A cantilever is the clearest case: its largest moment sits right at the wall, where the shear equals the full applied load.
- At an applied concentrated moment. A point moment makes the BMD jump vertically, so a peak can sit at that discontinuity — with no help from the shear diagram at all.
Our worked examples already show two of these. In Example 1 the peak is a genuine V = 0 crossing — 26.67 kN·m right under the load. In the overhang of Example 2 the story is richer: the largest magnitude is the sagging 22.05 kN·m at x = 2.1 m, while the hogging peak of −20 kN·m sits over support B. Reading only "V = 0" would have found the sag and missed nothing here, but on a pure cantilever it would have pointed you at the wrong section entirely.
Points of contraflexure
A point of contraflexure (or point of inflection) is where the bending moment passes through zero and changes sign — the beam stops sagging and starts hogging, so the tension face flips from bottom to top. In Example 2 this happens between the sagging peak at x = 2.1 m and the hogging moment over support B: somewhere in between, M = 0.
These points matter in real design. They tell you which flange is in tension along each stretch of beam, and therefore which flange needs lateral bracing; they are also natural places to splice a continuous member, because there is (almost) no moment to transfer. You can watch contraflexure appear live — drag the loads in the shear and moment diagram calculator and see the BMD cross the axis.
Worked example 3: two-span continuous beam (free where others paywall)
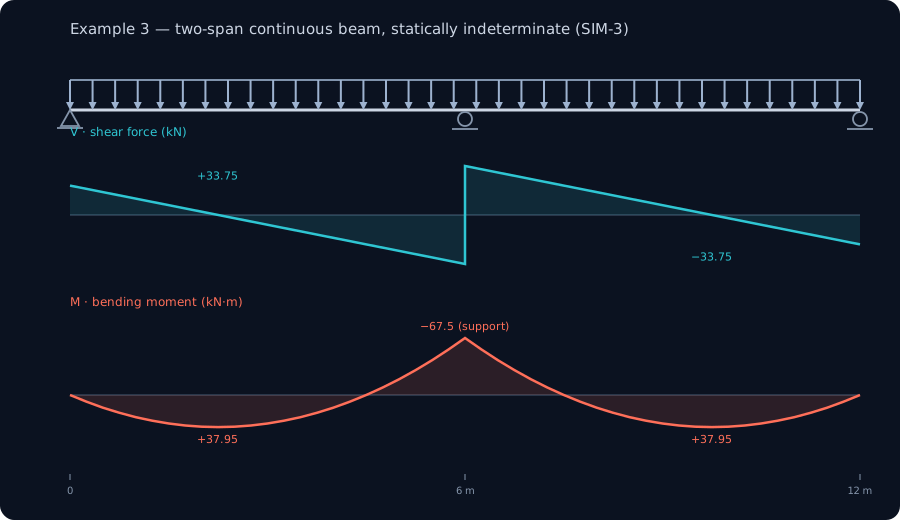
Add one support and everything changes. Take a beam running over two equal 6 m spans — supports at the two ends and one in the middle — carrying a uniform load of w = 15 kN/m across the whole length. There are three vertical reactions but only two useful equations of statics (ΣFy and ΣM). That extra unknown makes the beam statically indeterminate: equilibrium alone cannot solve it. The beam's own stiffness decides how the load shares out.
Physically, the interior support fights back. It cannot simply sit there — it pushes up hard, and in doing so it bends the beam over the top, creating a hogging moment across the middle support that the two end spans never see on their own.
The results
- Reactions: 33.75 kN at each end support and 112.5 kN at the interior support. Notice the middle support carries far more than half the load — it draws load toward itself precisely because it is stiff.
- Hogging over the interior support: −67.5 kN·m (which is exactly −wL²/8 for this symmetric two-span case). This is the governing moment, and it is negative — the top fibre is in tension over the support.
- Maximum sagging in each span: about 37.95 kN·m, well below the −67.5 kN·m hogging peak.
Compare this to a single simply supported 6 m span under the same load: wL²/8 = 15 × 6² / 8 = 67.5 kN·m of pure sagging. Making the beam continuous redistributes that moment — the span sags less (37.95 kN·m) and the support hogs more (−67.5 kN·m). The peak magnitude is similar, but it has moved and changed sign, and now there are points of contraflexure to track in each span.
Why this needs software
Solving this by hand means moment distribution (Hardy Cross, 1930), the three-moment equation, or slope-deflection — all workable, all tedious, and all easy to slip up on once you have unequal spans, pattern loading, or several load combinations. This is exactly the territory where many tools put up a paywall.
The CalcSteel FEM engine solves the indeterminate beam directly and matched the textbook indeterminate result to three decimals — and it does it in your browser, free. Real design also demands pattern loading: load one span, then the other, then both, and envelope the worst case. That is minutes of hand work per combination, or one click here.
The climax: a full portal frame
Now bend the beam into a building. A portal frame is the workhorse of steel construction — two columns and two rafters welded into one rigid skeleton, the kind that carries almost every warehouse, shed and industrial hall you have ever parked next to. Here the columns and rafters are no longer separate members passing loads through pins; they are one continuous rigid member, and bending moment flows unbroken around the corners.
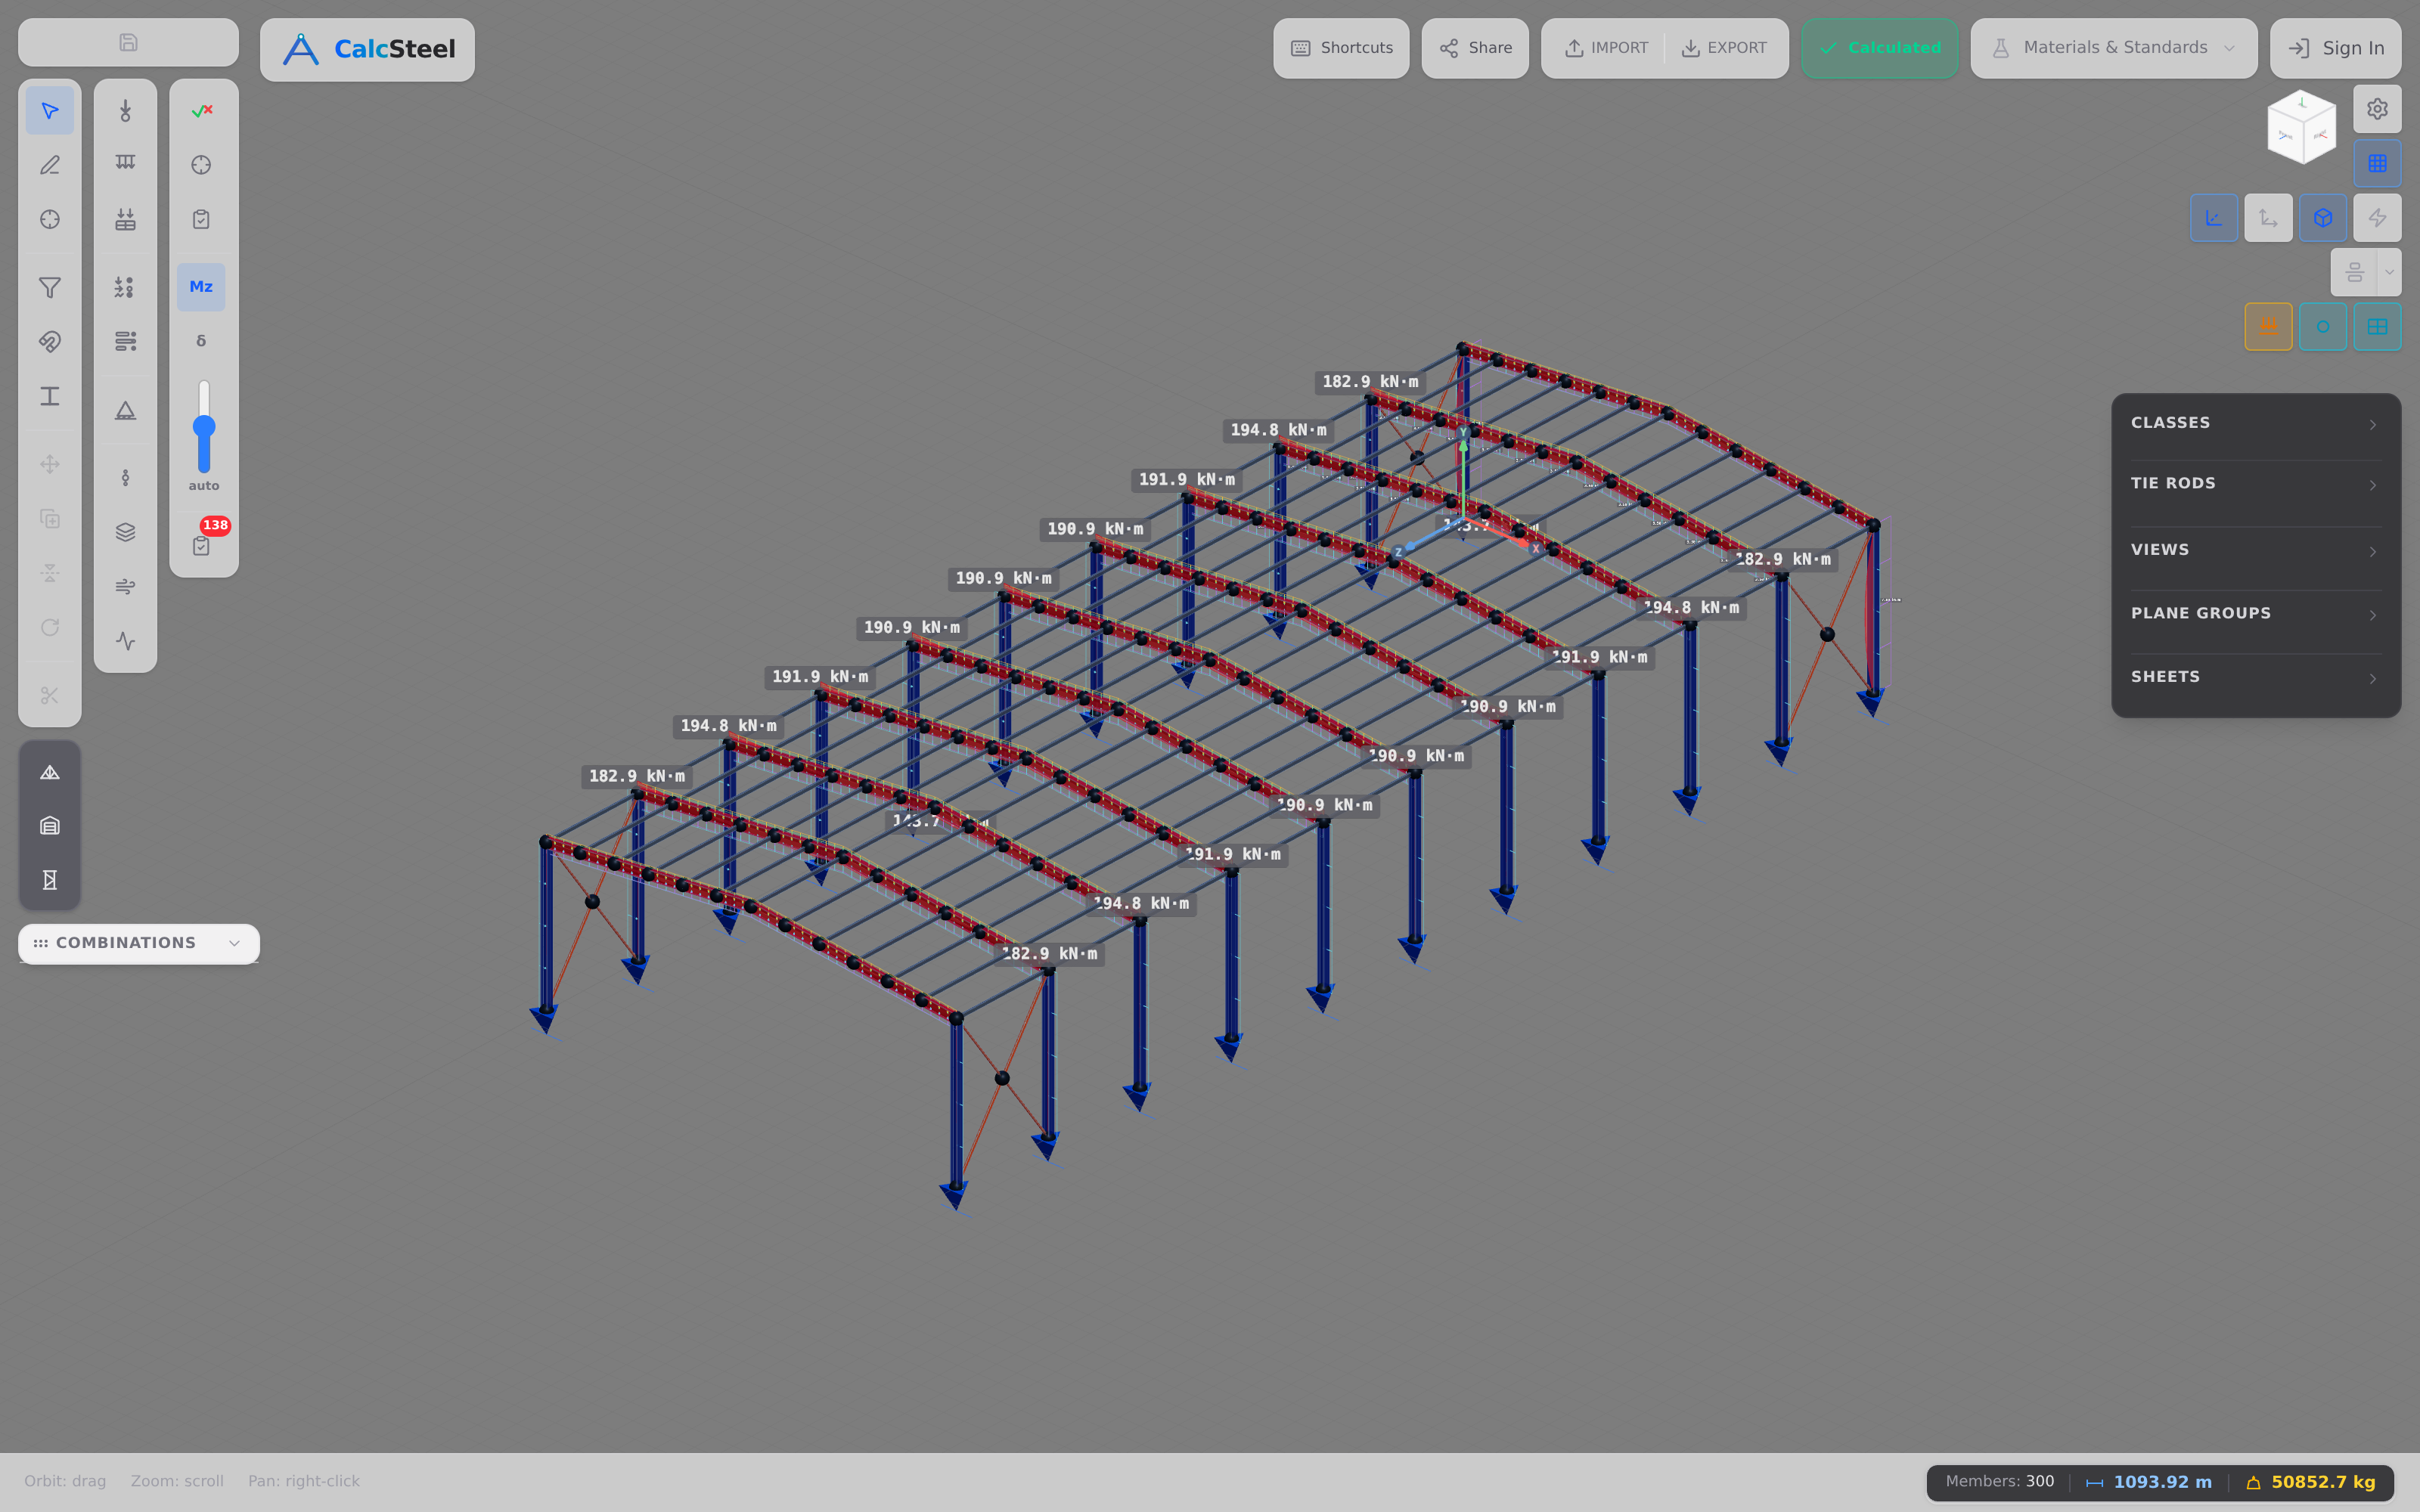
Take a real frame: a 12 m span, 6 m eave columns, a 10° roof pitch, gravity load w = 12 kN/m on the rafters, plus a 15 kN lateral wind push, with fixed bases. This frame is a statically indeterminate sway frame — there is no closed-form textbook formula for it. The rigid corners (the "knees") and the fixed feet give more restraints than statics can resolve, and the wind makes the whole frame lean sideways (sidesway). Only a real analysis engine gets the answer.
What the engine finds
- Peak rafter moment ≈ 149.1 kN·m, with the apex moment ≈ 147.0 kN·m near the ridge.
- Knee (eave) moment ≈ 28.8 kN·m — the corners pick up real moment because they are rigid, not pinned.
- Base reactions: horizontal ΣFx = −15 kN (the fixed feet balance the wind exactly), vertical ΣFy ≈ 146 kN (the total gravity load, delivered back to the ground).
The redistribution story
Here is the insight that makes the whole article worth reading. If that 12 m rafter were a simply supported beam under the same w = 12 kN/m, its midspan moment would be wL²/8 = 12 × 12² / 8 = 216 kN·m. As a rigid portal frame, the rafter peak drops to about 149 kN·m — because the stiff knees pull moment out of the span and into the corners and columns. The frame shares the work around every joint instead of dumping it all at midspan.
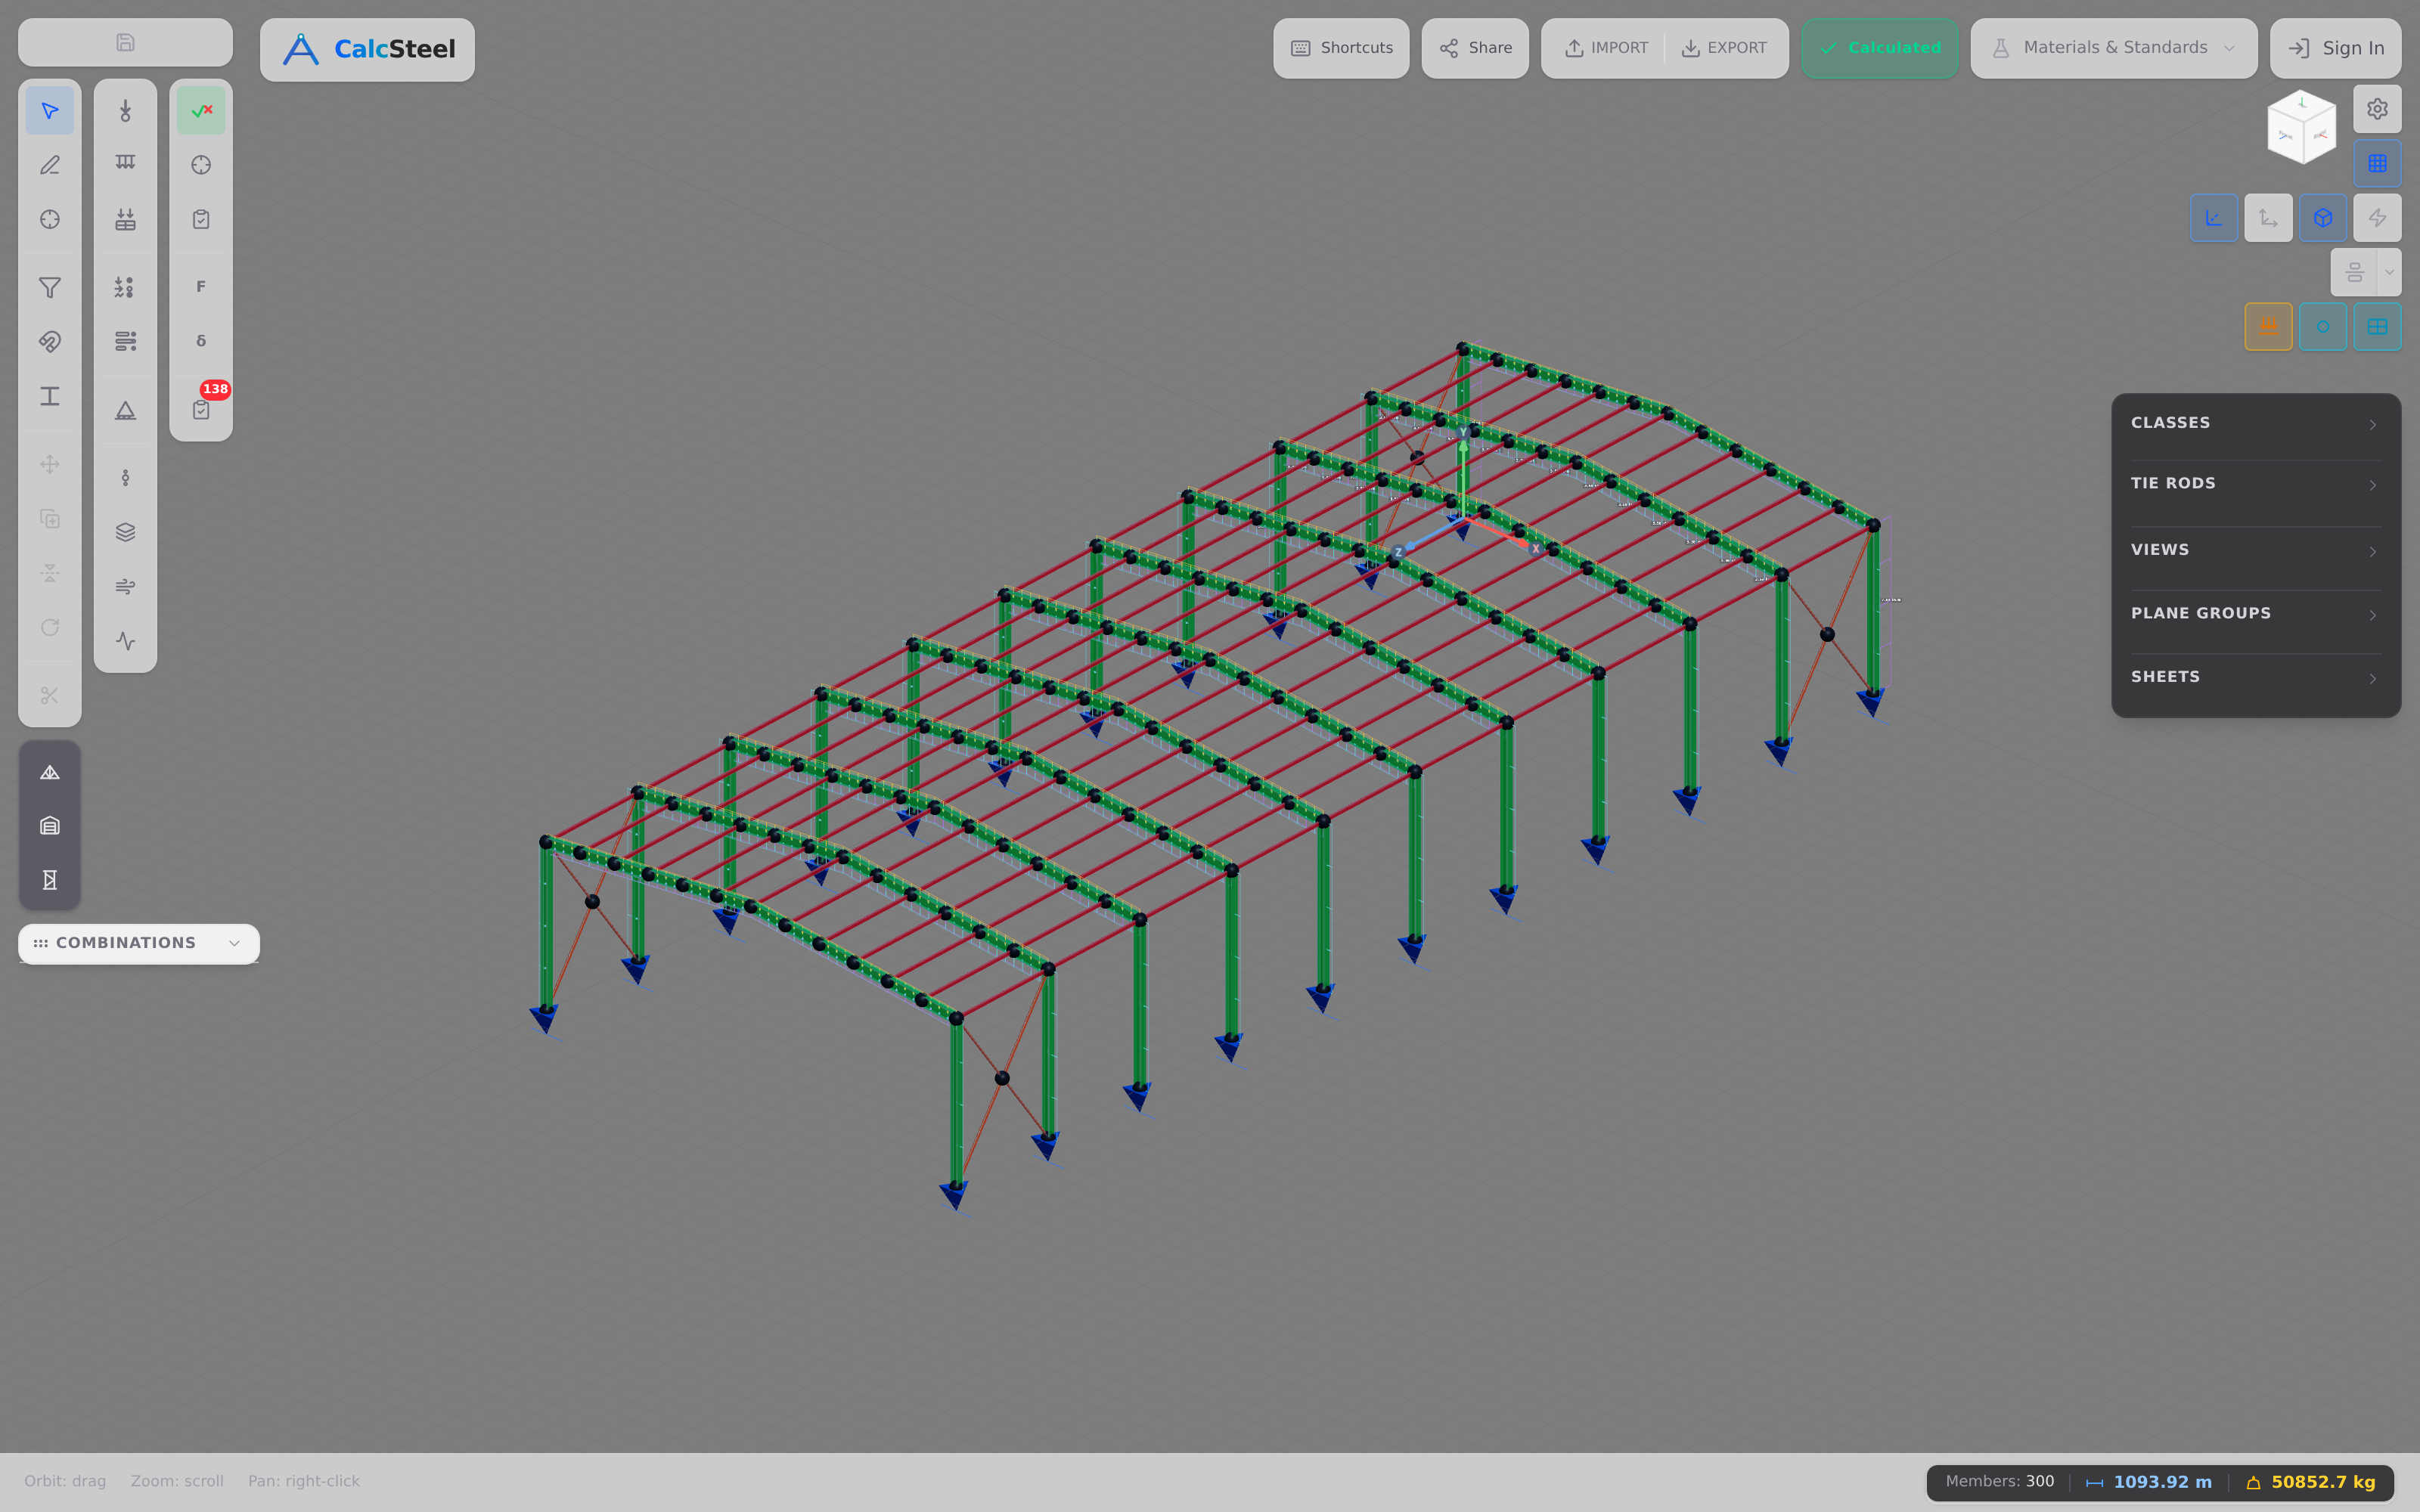
That redistribution is the entire reason frames are efficient — and the entire reason they need software. There is no hand formula for a fixed-base sway frame; you need the finite element method. This exact frame is not a toy: it is a real steel building modelled in the CalcSteel editor, and the same FEM engine that draws its bending-moment diagram runs free in your browser.
From diagram to design: sizing the member
A bending moment diagram is not the destination — it is the input to a design decision. Once you know the peak moment, the whole point is to choose a steel section that can carry it with margin to spare. That step is where the diagram finally becomes a beam you can actually build.
The governing inequality is simple. The section must supply more moment capacity than the demand:
W ≥ M / fyd
Here M is the design moment straight off your BMD, fyd is the design yield stress (the characteristic yield fy divided by the material safety factor — γa1 in NBR 8800, or absorbed into φ in AISC 360), and W is the section modulus you need to look up in a profile table. Rearranged the other way, the moment capacity of a chosen section is MRd = W · fyd, and the design is valid when MRd ≥ MSd.
Which section modulus you use depends on how the cross-section behaves — and this is the detail most beginners skip. Check the section classification first.
- Compact (plastic) sections — the flanges and web are stocky enough to reach the full plastic hinge without local buckling. Here you design plastically and use the plastic modulus Z (called Z in AISC, Wpl in NBR/Eurocode). The section develops its plastic moment Mpl = Z · fyd, which is meaningfully larger than the elastic limit.
- Non-compact or slender sections — thin flanges or a slender web buckle locally before the whole section yields. You are limited to first-yield behaviour, so you use the elastic modulus Wel and MRd = Wel · fyd. Slender elements need a further reduction.
The ratio Z / Wel is the shape factor — roughly 1.12–1.18 for a rolled I-section bent about its strong axis. Ignore it and you either leave capacity on the table or, worse, assume a plastic capacity a non-compact section cannot deliver.
Take the portal frame from the previous section. The rafter peak of ≈149.1 kN·m is the design moment for that member. Divide by fyd for your steel grade and you have the minimum W the rafter must provide — then pick the lightest rolled or welded profile that clears it, and confirm its class supports the modulus you used. That is the entire logic of flexural member selection, compressed into one moment value and one division.
The last step is the utilization check: the ratio of demand to capacity, MSd / MRd. Below 1.0 the member passes; the closer to 1.0, the more efficiently you have used the steel. A serious design also verifies shear (VSd / VRd), lateral-torsional buckling, and the combined axial-plus-bending interaction for frame members — a column-rafter carries both, so the true check is an axial-bending interaction, not bending alone. In CalcSteel this happens automatically: the same FEM run that draws the diagram classifies every section, applies your chosen code (NBR 8800 or AISC 360), and colours each member by its utilization — green for comfortable, red for overstressed — so you see exactly which members drive the design.
Common mistakes & FAQ
The theory is clean, but the same handful of errors trip up students and practising engineers alike. Run through this checklist before you trust any diagram — by hand or from software.
- Assuming the maximum moment is always where V = 0. It is not. The peak moment lands where shear crosses zero within a span, but it can equally sit at a fixed support (a cantilever peaks at the wall, where shear is maximum, not zero) or exactly at an applied concentrated moment. Always scan the supports and the point-moment locations too.
- Treating frame corners as pins. A welded or bolted-stiffened knee is a rigid connection — moment flows continuously from column into rafter. Model it as a pin and you delete the knee moment (≈28.8 kN·m in our portal) and badly misread how the frame actually works.
- Forgetting the reactions must close. The shear diagram must return to exactly zero after the last reaction, and ΣFx, ΣFy, ΣM must all balance. A residual is an arithmetic error, full stop.
- Missing the shear jump at point loads. Every concentrated load P makes the SFD jump by exactly P; every applied moment M₀ makes the BMD jump by M₀ while leaving the shear untouched. Smooth curves through a point load are always wrong.
- Ignoring hogging on overhangs and continuous beams. Cantilever tails and interior supports produce negative moment that puts the top fibre in tension. That flange needs bracing and often governs the design — the −20 kN·m over the support in our overhang example and the −67.5 kN·m interior hogging in the two-span beam are exactly these cases.
- Sizing on bending alone. A moment diagram sizes the flanges, but the member still has to pass shear, lateral-torsional buckling, and — for any column or rafter — combined axial and bending. The BMD is the start of the check, not the whole of it.
Is the maximum bending moment always where the shear is zero?
No. Within a simply supported span it is, because dM/dx = V means the moment stops climbing exactly where the shear passes through zero. But the global maximum can occur at a fixed support (a cantilever's worst moment is at the wall, where the shear is largest) or precisely at a point where an external concentrated moment is applied. Check V = 0 crossings, every support, and every applied moment, then take the largest magnitude.
What is a point of contraflexure (or inflection)?
It is the location where the bending moment passes through zero and changes sign — the beam switches from sagging to hogging or vice versa. Physically the curvature reverses, so the tension face flips from bottom to top. Points of contraflexure appear in overhangs, fixed-end beams and continuous beams, and they matter because they mark where you can splice a member with minimal moment and where the braced flange changes.
Why can't I solve a portal frame with the wL²/8 formula?
Because wL²/8 is only valid for a simply supported single member. A rigid portal frame is statically indeterminate — the fixed bases and continuous knees add more unknowns than equilibrium alone can resolve, and the columns and rafters share moment through the joints. There is no closed-form answer; you need a stiffness/FEM solution. That redistribution is precisely why a 12 m rafter under w = 12 kN/m peaks near 149 kN·m as a frame instead of the 216 kN·m a simple beam of the same span would see.
Do distributed and point loads give different diagrams?
Yes, characteristically. A uniform load makes the shear vary linearly and the moment curve as a parabola. A point load makes the shear constant between loads with a sharp step at the load, and the moment vary linearly with a kink at the load. Recognising the shape — straight vs. curved, stepped vs. sloped — is the fastest way to sanity-check any diagram at a glance.
Key takeaways
You have travelled the whole road — from a single cut through a simple beam to the moment redistribution inside a rigid steel frame. Here is what to carry away.
- Two relations govern everything. dV/dx = −w and dM/dx = V — the slope of one diagram is the height of the next, and the moment reaches an extremum where the shear crosses zero within a span.
- The maximum moment isn't always at V = 0. It can sit at a fixed support or at an applied concentrated moment. Scan the crossings, the supports, and the point-moments, then take the largest.
- Supports and continuity change the story. An overhang drives hogging over its support (−20 kN·m in our example); a two-span continuous beam pulls −67.5 kN·m of hogging over the interior support — statically indeterminate cases where hand methods get hard and software solves instantly.
- Frames redistribute moment. The same 12 m span that would peak at 216 kN·m as a simple beam settles near a 149 kN·m rafter moment once it acts as a rigid portal — the knees pick up moment, the bases balance the wind, and only FEM can find it.
- The diagram is the start of the design. Mmax sets the required section modulus (W ≥ M / fyd), the section class decides plastic Z vs. elastic Wel, and the utilization ratio tells you whether the member passes.
Now stop reading and start drawing. Punch in your own span, loads, and supports in the free shear & bending moment diagram calculator — unlimited, no login for the math — and watch the SFD and BMD update live. When you are ready for the full building, CalcSteel runs the same real FEM engine on complete portal frames right in your browser, on a genuinely free plan, with every diagram, section classification and code check included. Students get everything unlocked through CalcSteel Education, free. The proof isn't a countdown — it's the tool itself, in your hands today.
Sources
Try CalcSteel for free
Model, analyze and design steel structures in your browser. No install, no signup.
Open the 3D editor