Influence Lines: Where to Park the Load So the Beam Suffers the Most
A beam does not fail in the abstract. It fails when the load sits in the one spot that hurts most, and influence lines are the tool that finds that spot. This guide explains what an influence line is, how it differs from a shear or moment diagram, and how to read one to place a load for the worst reaction, shear or moment. Four worked examples are checked bar by bar against the CalcSteel finite-element engine: a simple beam, a single travelling load, pattern loading on a continuous beam, and a moving crane train.
Key takeaways
- An influence line plots ONE response, a reaction or the shear or moment at a chosen section, as a single unit load walks across the structure. It answers a different question from a shear or moment diagram: not how big M is everywhere for a fixed load, but where the load must sit to make this one effect worst.
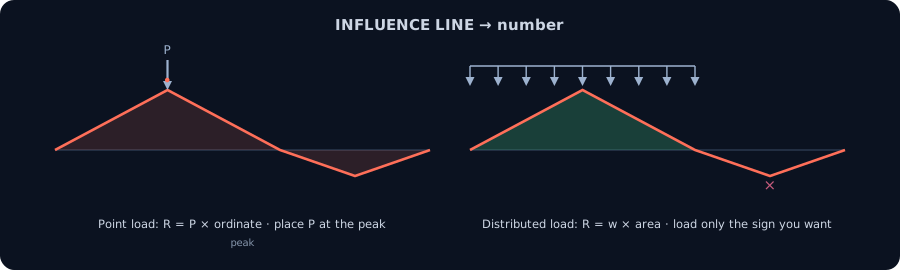
- To use it, a point load P gives response = P × (the influence-line ordinate under the load), so you park the load at the largest ordinate; a distributed load w gives response = w × (the area under the influence line), applied only over the parts whose sign you want.
- Müller-Breslau's principle turns drawing an influence line into a sketch: release the restraint that carries the effect, push a unit displacement through it, and the deflected shape is the influence line, even for statically indeterminate beams.
- For a single moving load the worst bending is at midspan, M = PL/4. For a two-span continuous beam the worst span sag comes from loading only ONE span, about 36 percent more than loading both, while the worst support hogging needs BOTH spans loaded.
- For a train of wheels, a crane runway or a bridge, the absolute maximum moment is not with the loads centred. It falls under the wheel nearest the resultant, positioned so the span centreline bisects the gap between that wheel and the resultant.
The question influence lines answer
Ask a first-year student where a simply supported beam feels the most bending and the answer comes fast: the middle. Ask where to put a single wandering load to make that bending as large as it can be, and the confident ones still say the middle, and this time they are right, but for a reason they usually cannot prove. Move the question to a two-span floor beam, or to a crane rail with two wheels rolling along it, and intuition quietly runs out. Loading every span looks conservative and turns out not to be. Centring a pair of wheels looks obvious and turns out to be slightly wrong.
An influence line is the instrument that settles all of these questions with one picture. It is a plot of a single chosen effect, say the reaction at a support, or the bending moment at one particular cross section, as a unit load travels from one end of the structure to the other. Read it correctly and it tells you exactly where to park the load to make that effect a maximum, and how large the maximum will be. This is the tool behind every crane-runway calculation, every bridge live-load lane, and every pattern-loading rule in a concrete or steel floor code.
Everything below is checked against the CalcSteel finite-element engine, the same solver that powers the free shear and moment diagram calculator. You can drive that tool yourself at the end of the article and watch a moment change as you slide the load.
What an influence line actually is, and how it differs from a moment diagram
An influence line for a response R is a graph whose horizontal axis is the position of a moving unit load and whose vertical axis is the value R takes for that load position. One influence line describes one response only: the reaction at A, or the shear at section C, or the moment at section C, each has its own separate influence line.
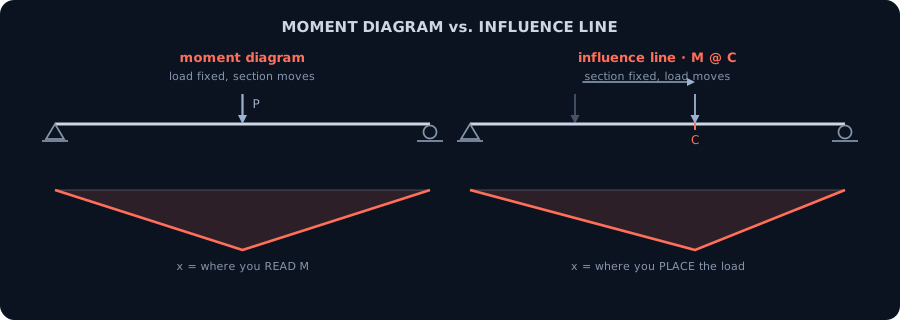
This is the single distinction that trips people up, so it is worth stating slowly. A bending moment diagram and an influence line look similar, both are curves drawn under a beam, but they answer opposite questions:
- A moment diagram fixes the load and varies the section: the load arrangement is frozen, and the curve shows the moment at every point along the beam for that one arrangement.
- An influence line fixes the section and varies the load: the section is frozen (say, mid-span), and the curve shows the moment at that one section as the load moves everywhere.
So the horizontal axis carries a different meaning in each. On a moment diagram it is the coordinate of the point where you read the moment. On an influence line it is the coordinate where you place the load. The ordinate of an influence line is a sensitivity: it says how much the chosen effect grows per unit of load sitting at that position. That interpretation, effect per unit load at a position, is what makes influence lines the right tool the moment loads start to move.
Worked example 1: the three influence lines of a simple beam
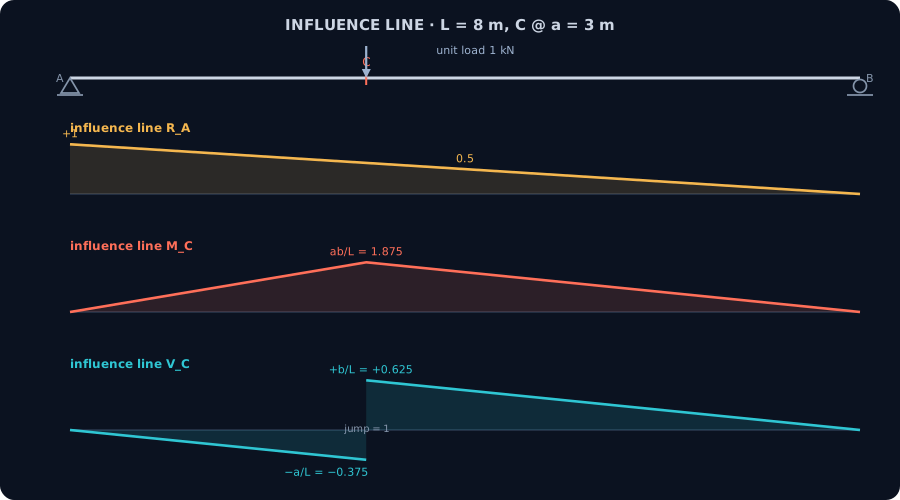
Take a simply supported beam of span L = 8 m, pinned at A and on a roller at B, and pick an interior section C at a = 3 m from A, so b = 5 m to B. We will build three influence lines: for the left reaction RA, for the shear VC, and for the moment MC. In each case imagine a single downward unit load (1 kN) parked at position x, and record the effect.
Reaction R_A: a straight line
Statics gives RA = (L − x) / L directly. When the load is over A it takes all of it (ordinate 1.0); when it is over B, A carries none (ordinate 0). The influence line is a straight line sloping from 1 down to 0. CalcSteel confirms it point by point: 1.000 at A, 0.750 at x = 2 m, 0.500 at mid-span, 0.000 at B.
Moment M_C: a triangle peaking at ab/L
With the load to the right of C, MC = RA·a = a(L − x)/L; with it to the left, MC = RB·b = b·x/L. Both branches are straight and meet at C, where the ordinate reaches its maximum, the classic a·b/L = 3 × 5 / 8 = 1.875 m. The engine returns exactly 1.875 at C, tapering to zero at both supports. The shape is a triangle whose apex sits under the section.
Shear V_C: two triangles with a unit jump
This is the influence line students get wrong most often. Just to the right of C the ordinate is +b/L = +0.625; just to the left it is −a/L = −0.375; the two are separated by a vertical jump of exactly 1.0 at C, the footprint of the unit load crossing the section. The CalcSteel shear just right of C reads 0.625 and just left reads −0.375, matching the theory to three decimals.
These are not just tidy shapes. They are the raw material for every loading decision that follows, and the fact that the finite-element engine reproduces the closed-form ordinates exactly is what lets you trust it on the harder cases where no closed form exists.
Reading an influence line: the two rules that use it
An influence line is only worth drawing because of two rules that turn it into a number. Both follow from the fact that its ordinate is the effect produced by a unit load at that position, and that the structure is linear, so effects add.
Rule 1, a concentrated load. A point load of magnitude P at position x produces a response equal to P multiplied by the influence-line ordinate at x. Two consequences drop out. First, to maximise the response you slide the load to the position of the largest ordinate. Second, the maximum value is simply P times that peak ordinate. For MC on the beam above, a 50 kN load parked at C gives 50 × 1.875 = 93.75 kN·m.
Rule 2, a distributed load. A uniform load of intensity w over some length produces a response equal to w multiplied by the area under the influence line beneath the loaded length. This is the rule that overturns intuition, because the influence line often has both positive and negative regions. To make the response as large as possible in one direction, you load only the parts of the span where the ordinate has that sign, and you deliberately leave the rest unloaded. A live load that could be anywhere should be placed where it does the most damage, not spread everywhere by reflex.
Rule 2 is the entire justification for pattern loading, also called chessboard or alternate-span loading, in floor design. We will see it decide a real continuous beam two examples from now.
Worked example 2: where to park a single travelling load
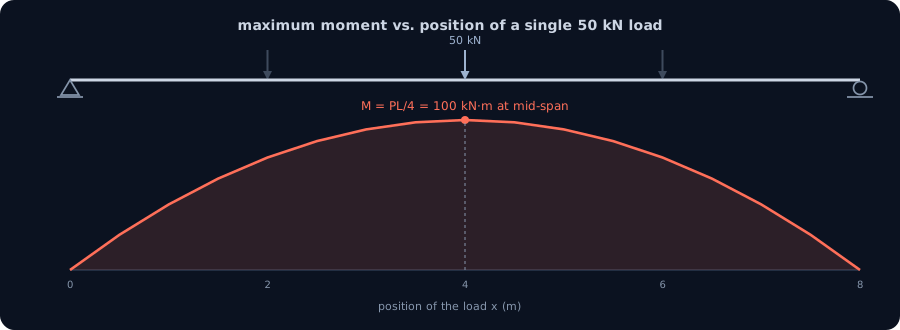
Now let a single load of P = 50 kN roll along the same 8 m simple beam and ask the headline question: across all possible positions, where is the beam worst, and how bad does it get? Rule 1 says the maximum moment at any fixed section happens with the load at that section, giving P·a·b/L for a section at a. But the section itself is now a free choice too, so we are looking for the position that maximises P·a·b/L over all sections, and a·b/L is largest when a = b = L/2.
The answer is therefore mid-span, and the value is the famous Mmax = P·L/4 = 50 × 8 / 4 = 100 kN·m. Sweeping the load across the beam in the CalcSteel engine and recording the peak moment at every position traces a smooth hump that tops out at exactly 100 kN·m with the load at x = 4 m, and falls away symmetrically toward the supports. Park the same 50 kN load at the quarter-point section C we used earlier and the worst it can do there is 93.75 kN·m, genuinely less than 100.
So the honest one-line answer to the title, for a single load on a simple beam, is: park it at mid-span. That is the whole content of the moment influence line for the mid-span section, whose peak ordinate is L/4. The reason this matters is that almost nothing in real design is a single load on a simple beam, and the moment you add a second support or a second wheel, the answer moves somewhere you would not have guessed.
Müller-Breslau: sketch any influence line without algebra
Writing equations for each branch works on a simple beam, but it becomes miserable on a continuous one. Fortunately there is a shortcut that is one of the most elegant results in structural analysis, and it is where the history of the subject lives. The German engineer Emil Winkler introduced influence lines around 1868 for exactly the problem of moving railway loads on bridges. Two decades later Heinrich Müller-Breslau gave the qualitative principle that still carries his name.
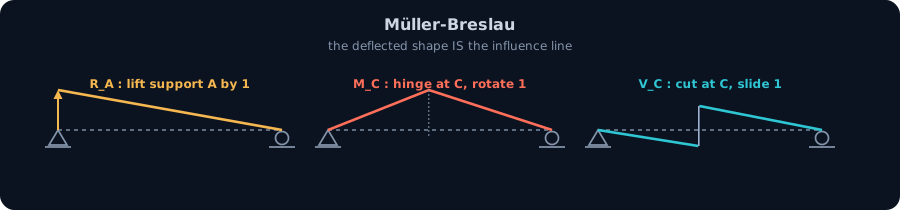
Müller-Breslau's principle: to obtain the influence line for any reaction or internal force, remove the restraint that carries that force, impose a unit displacement (or rotation) at the release in the positive direction of the force, and the resulting deflected shape of the structure is the influence line for that force.
Read it slowly with the three lines from example 1. For the reaction RA, remove support A and lift it by a unit: the beam rotates as a straight rigid line about B, which is exactly the straight influence line from 1 to 0. For the moment at C, insert a hinge at C and rotate a unit: the two segments kink into the triangle we drew. For the shear at C, cut the beam at C and slide one side up relative to the other by a unit: the two branches separate by that unit jump. The shapes fall out of the deflected geometry, with no equilibrium algebra at all.
The real payoff is that the principle does not care whether the structure is statically determinate. For a continuous beam the released shape is a smooth curve rather than straight segments, but it is still the influence line, and it still tells you, by its sign, which spans to load. That is precisely what we need next.
Worked example 3: pattern loading a continuous beam
Here is where the intuition of a first-year student breaks and influence lines earn their place in every code. Take a two-span continuous beam, each span L = 6 m, carrying a uniform live load of w = 15 kN/m that may or may not be present on either span. Three supports: A at the left end, M in the middle, C at the right end. The question is not what one load arrangement does, but which arrangement is worst for each effect.
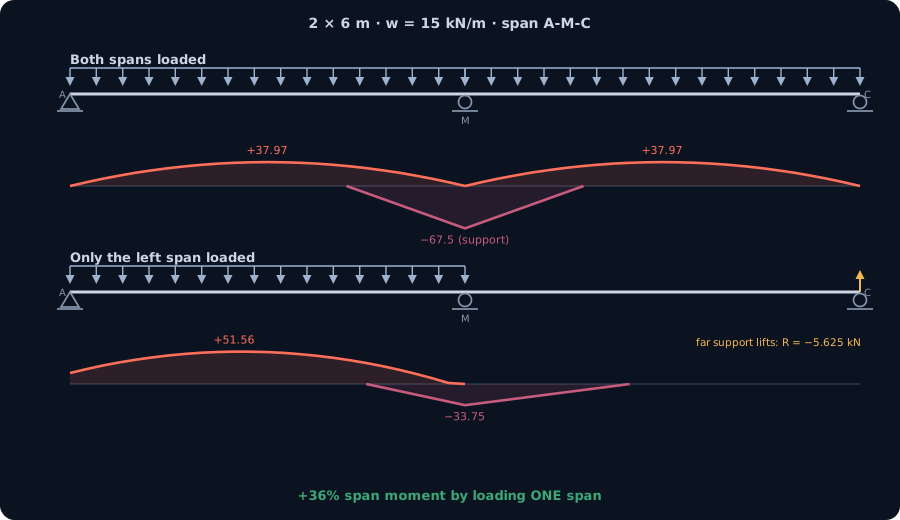
By Müller-Breslau, the influence line for the sagging moment at the middle of the left span is positive over the left span and negative over the right span. Rule 2 then says: to maximise that sagging moment, load only the left span and leave the right span bare. The CalcSteel engine confirms the payoff precisely:
- Both spans loaded: the mid-span sagging moment is 37.97 kN·m (the textbook 9wL²/128), and the hogging moment over the central support is −67.5 kN·m (wL²/8).
- Only the left span loaded: the mid-span sagging moment climbs to 51.56 kN·m, about 36 percent higher, even though there is now less total load on the beam.
Loading the whole beam, the instinctive conservative move, actually relieves the span you were worried about, because the load on the far span pushes the shared support up and bends the near span back. The influence line saw that coming from its change of sign.
And the worst case is different for each effect. The peak hogging over the central support wants both spans loaded (−67.5 kN·m), because that influence line is negative over both. There is a sting in the tail too: with only the left span loaded, the engine reports the far reaction at C as −5.625 kN, a pull downward, meaning the beam tries to lift off its end support. A load on one span can uplift the other end, a detail that influence lines make obvious and a single load case hides. This is why diagrams alone are not enough once a structure is continuous.
Worked example 4: crane wheels and bridge trains
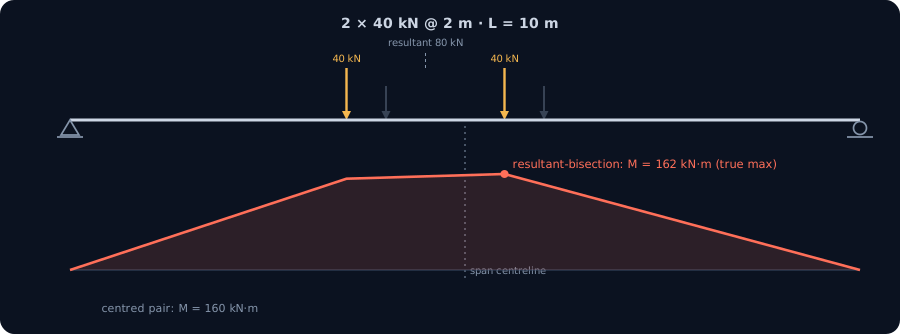
The last case is the one that pays the bills for anyone sizing a crane runway or a bridge girder: not one load, but a set of loads at fixed spacing rolling together. Take two wheels of 40 kN each, 2 m apart, on a simply supported beam of span L = 10 m. Where along the beam should the pair sit to produce the absolute maximum bending moment, and what is it?
The tempting answer is to centre the pair on the span, wheels at 4 m and 6 m. Do that and the engine reports a maximum moment of 160 kN·m. But it is not the true maximum. The exact criterion, which comes straight from the moment influence line for a moving section, is the resultant-bisection rule: the absolute maximum moment occurs under the wheel nearest the resultant of the group, when that wheel and the resultant are placed equidistant from the centreline of the span.
The resultant of two equal 40 kN wheels sits midway between them, 1 m from each. Placing one wheel 0.5 m past the centreline puts that wheel and the resultant symmetric about mid-span. That means wheels at 3.5 m and 5.5 m, and the CalcSteel sweep confirms the maximum there is 162 kN·m, under the wheel at 5.5 m. It is only 2 kN·m above the centred guess here, but the principle is exact, and for unequal wheels or wider spacing the gap between the naive guess and the true maximum grows large enough to change a section.
This is the whole reason influence lines exist as an engineering tool rather than a classroom curiosity. A crane manufacturer gives you wheel loads and spacings; the influence line, plus the resultant-bisection rule, tells you where on the rail they do their worst and how big the design moment is, without trying every position by hand.
Try it: move the load and watch the moment
The fastest way to feel an influence line is to become the moving load. In the calculator below, set up a beam, place a point load, and drag it along the span while you watch the bending moment diagram redraw. The peak of the moment at any chosen section, traced as you slide the load, is that section's influence line, exactly the experiment behind every number in this article. Change the beam to two spans and you can watch the pattern-loading effect from example 3 appear in front of you.
It runs in your browser, with no sign-up for the mathematics, on the same finite-element engine that produced every verified figure above. When you are ready to move from a single beam to a full frame, the same solver checks members to AISC 360, Eurocode 3 and NBR 8800.
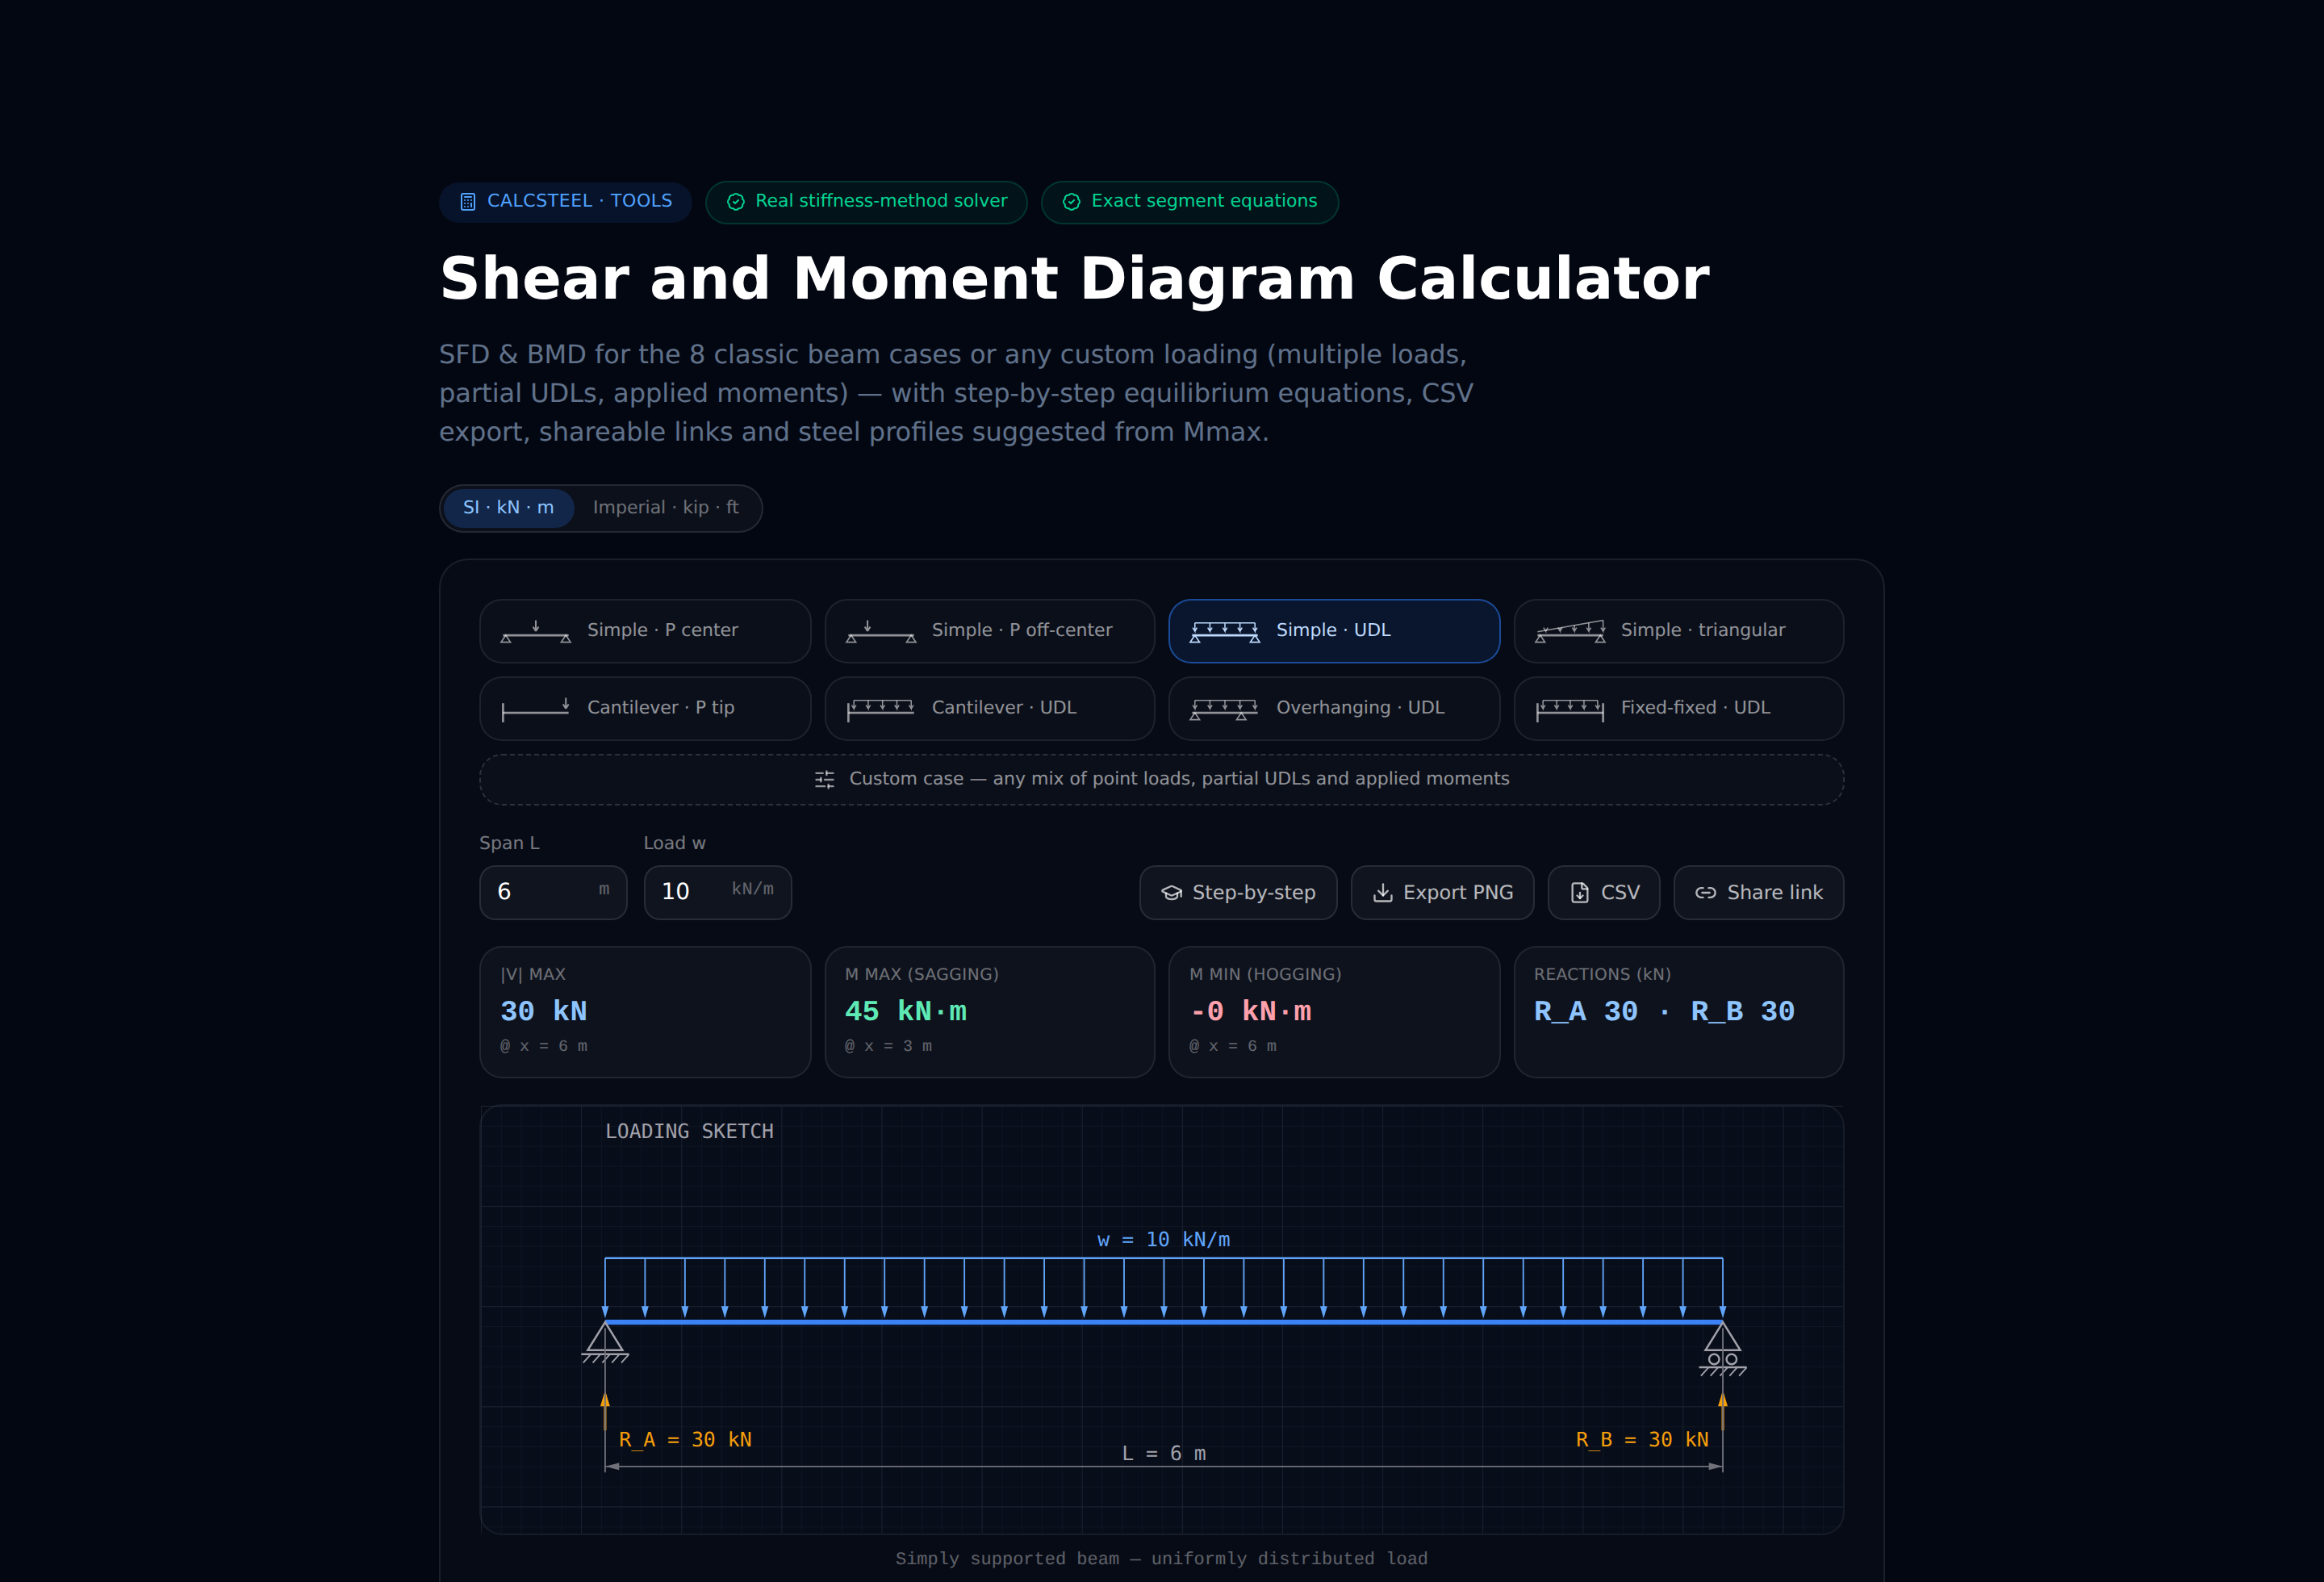
|V| max
30 kN
@ x = 6 m
M max (sagging)
45 kN·m
@ x = 3 m
M min (hogging)
-0 kN·m
@ x = 6 m
Reactions (kN)
R_A 30 · R_B 30
Simply supported beam — uniformly distributed load
Segment equations — x in m, from the left end
0 m ≤ x ≤ 6 m
V(x) = 30 − 10·x [kN]
M(x) = 30·x − 5·x² [kN·m]
Profiles that resist this moment
Md = 45 kN·m → required Wx = Md / (fy/γa1) = 45 kN·m / (250/1.1) = 198 cm³
Bending screen (Wx ≥ Md/(fy/γa1), NBR 8800 γa1 = 1.10 — AISC 360 φb = 0.90 is nearly identical); plastic Zx is valid for compact sections only. δ is the elastic deflection of THIS loading with E = 200 GPa and the section's Ix (loads taken at service value). LTB, shear, compactness and code deflection limits are verified on the profile page and in the 3D editor. "Open in 3D editor" recreates THIS beam — span, supports and every load — with the profile already assigned.
Putting influence lines to work
Influence lines answer the question that shear and moment diagrams cannot: not how a fixed load flows through a structure, but where a movable load must sit to hurt it most. The recipe is short and never changes. Draw the influence line for the one effect you care about, by statics on simple structures or by Müller-Breslau's deflected shape on anything harder. Then read it: place concentrated loads at the largest ordinate, and place distributed loads over the regions whose sign you want, leaving the rest bare.
Three results are worth carrying out of this article. A single load on a simple beam is worst at mid-span, PL/4. A continuous beam wants pattern loading, one span here, both spans there, with a different pattern for each effect, and loading everything is not conservative. A train of wheels is worst not when centred but at the resultant-bisection position. Each of these once cost engineers pages of trial positions; each falls straight out of an influence line.
Modern software builds these envelopes automatically, sweeping loads across the model and reporting the worst case per member, which is what turns a fiddly hand method into a routine check. Start with the shear and moment calculator to build the intuition, confirm your reactions and your moments by hand, and let the model carry the bookkeeping when the loads start to move.
Sources
- 1.Influence line (structural analysis), Wikipedia
- 2.Müller-Breslau's principle, Wikipedia
- 3.Emil Winkler (introduced influence lines for moving loads, c. 1868), Wikipedia
- 4.AISC Steel Design Guides (Design Guide 7: Industrial Building Design, crane runway loads)
- 5.FHWA / AASHTO LRFD Bridge Design Specifications (vehicular live load and influence surfaces)
Try CalcSteel for free
Model, analyze and design steel structures in your browser. No install, no signup.
Open the 3D editor