Golden Gate Bridge Structure: How It Carries Load
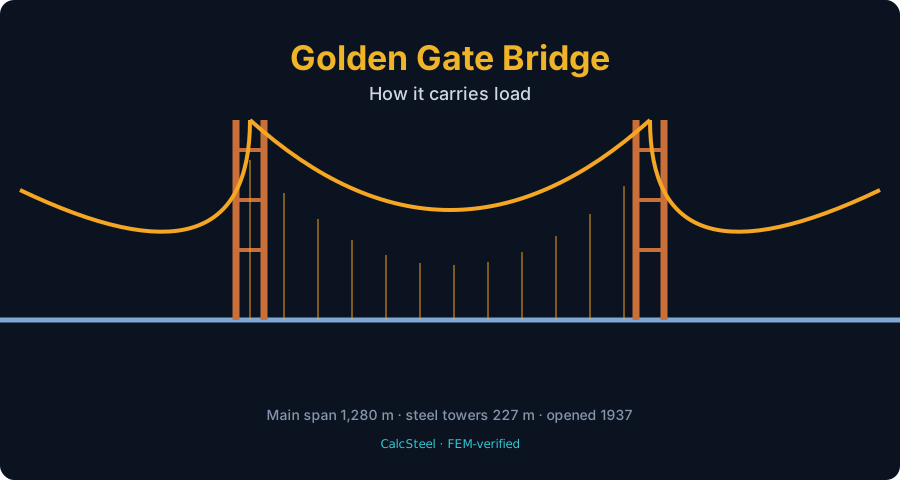
How the Golden Gate Bridge carries load: two steel towers, two giant cables, and a slender deck made possible by deflection theory, all reproduced in a real FEM engine plus a free beam calculator.
Key takeaways
- It is a pure suspension bridge: two main cables in tension hang the deck from two 227 m steel towers in compression, with no diagonal stays, which is exactly what makes deflection theory the star of the story.
- The deck behaves as a beam: our representative girder saw +375 kN·m under self-weight (wL²/8) and +450 kN·m from a 180 kN crossing load (PL/4), so the moving concentrated load governs even though it weighs less in total.
- Depth equals stiffness: a deep W690x125 deflected 8.44x less than a shallow W360x51 under identical load (delta is proportional to 1/I), tracking its 8.44x larger moment of inertia.
- Deflection theory let the deck stay slender because the cables' dead-load tension supplies the stiffness, which is why a 1,280 m span could be built with a comparatively shallow truss.
- The 1951 windstorm cashed that bet: the slender deck undulated enough to close the bridge, and the answer was a lower lateral bracing system added in 1953 to 1954.
Golden Gate Bridge structure, from the cable down to the deck
When it opened on 27 May 1937, the Golden Gate Bridge was the longest suspension span on Earth, a 1,280 m (4,200 ft) leap across the strait between San Francisco and Marin County that no bridge would beat until 1964. Its two towers rise 227 m (746 ft) above the water, painted the now-famous International Orange, and for millions of people it is simply the most beautiful structure ever built. For an engineer, it is something more specific: a near-perfect teaching model of how a pure suspension bridge moves load from the deck, into the cables, down the towers, and out to the anchorages.
This is a case study written for engineers and students. We are going to take the bridge apart the way a structural engineer would: the load path, the deck that behaves like a beam, the deflection that decides whether a span is stiff or doomed, and the single idea that made the whole thing possible, Leon Moisseiff's deflection theory. Then we are going to reproduce the deck's numbers with a real finite-element engine. Every worked value below comes out of CalcSteel's shipping FEM solver, validated against closed-form theory to three decimals, and you can drive the same live beam calculator yourself, for free, right here in the article.
One honesty note up front, the same one we make on every case study: the worked examples are a representative modern-steel model of how the deck behaves as a beam. They are not the exact 1937 members, and nobody is going to re-derive the real stiffening truss to three decimals. What they capture is the physics that made the bridge work, in numbers you can check. If you have read our Brooklyn Bridge case study, keep it in mind, because the two bridges make opposite bets and the contrast is the whole point.
A pure suspension system, and why that matters
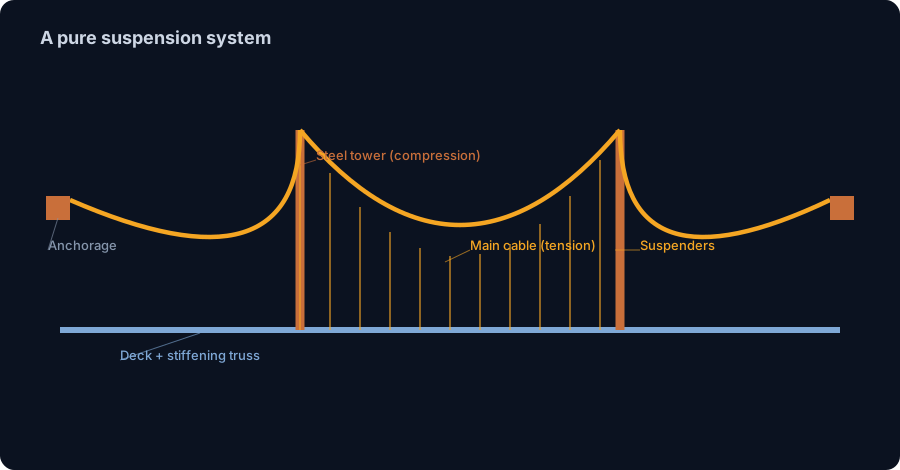
The most important structural fact about the Golden Gate is what it does not have. Unlike the Brooklyn Bridge, which is a hybrid of suspension cables, diagonal stays, and a deep stiffening truss all working at once, the Golden Gate is a pure suspension bridge. There are no fan-shaped diagonal stays. Load reaches the towers through one dominant system, and that clean, single-minded design is exactly why deflection theory had to be trusted rather than hedged.
The load path has four parts:
- Two main cables, the primary structure, sweeping in a catenary curve from anchorage to tower to anchorage and working purely in tension. Each cable is about 0.92 m (36.4 in) in diameter and was spun on site from 27,572 galvanized steel wires. The total wire in the two cables runs to roughly 129,000 km, enough to circle the Earth three times.
- The suspenders, vertical steel ropes that hang from the main cables at regular intervals and pick up the deck, carrying its weight up into the cables.
- The deck and stiffening truss, a trussed girder running the length of the roadway that ties the suspender points together and distributes concentrated loads along the span. This is the member we model as a beam in the worked examples.
- Two steel towers, rising 227 m and working in compression, that collect the cable force and drive it down to the foundations, plus the massive concrete anchorages that hold the cable ends against the relentless pull.
Cables in tension, towers in compression, deck in bending: three of the cleanest structural jobs in engineering, each doing exactly one thing. The elegance is real, but so is the risk, because a pure suspension span has almost no stiffness of its own until the cables are loaded. That is where Moisseiff comes in.
The people and the wind (1933 to 1954)
The Golden Gate is often credited to one man, and that is one of the quiet injustices of engineering history. It is worth walking the timeline, because the design decisions are inseparable from the people who fought over them.
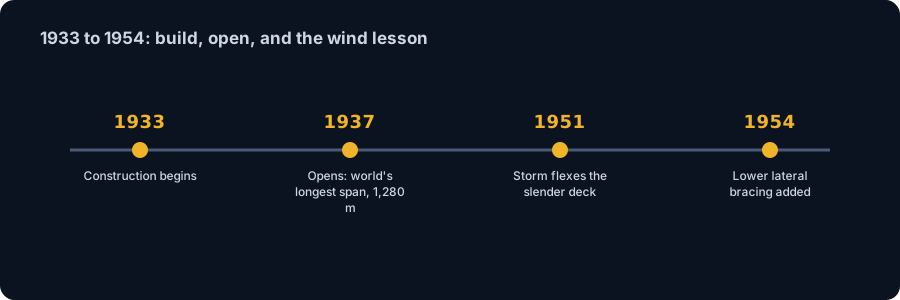
- 1933, construction begins. Chief engineer Joseph B. Strauss is the public face of the project and takes most of the credit. The real structural engineering, the cable and deck mathematics that actually made the span stand, was done largely by Charles Alton Ellis, who was pushed off the project and left uncredited for decades before his contribution was formally recognized.
- Deflection theory arrives. Leon Moisseiff, the era's leading suspension-bridge theorist, applies deflection theory to the design, the analytical breakthrough that let the deck be lighter and more slender than older bridges allowed. Consulting engineer Charles Derleth Jr. and architect Irving Morrow round out the team, Morrow giving the towers their Art Deco form and choosing the International Orange color.
- 27 May 1937, the bridge opens as the longest suspension span in the world, a record it held for 27 years. Eleven workers died during construction, a remarkably low toll for the era, partly thanks to a pioneering safety net that saved nineteen men.
- 1 December 1951, the storm. Winds gusting to around 69 mph (111 km/h) set the slender deck undulating and twisting so violently that the bridge was closed. The motion was a direct echo of the collapse of the first Tacoma Narrows Bridge in 1940, another Moisseiff deflection-theory design that had gone too far.
- 1953 to 1954, the fix. Engineers added a lower lateral bracing system between the bottom chords of the stiffening truss, sharply increasing the deck's torsional and lateral stiffness and settling the wind problem for good.
Keep the 1951 storm in mind. When we reach the deflection example, that undulating deck is the physical proof of the trade-off deflection theory made.
Why the deck is really a beam
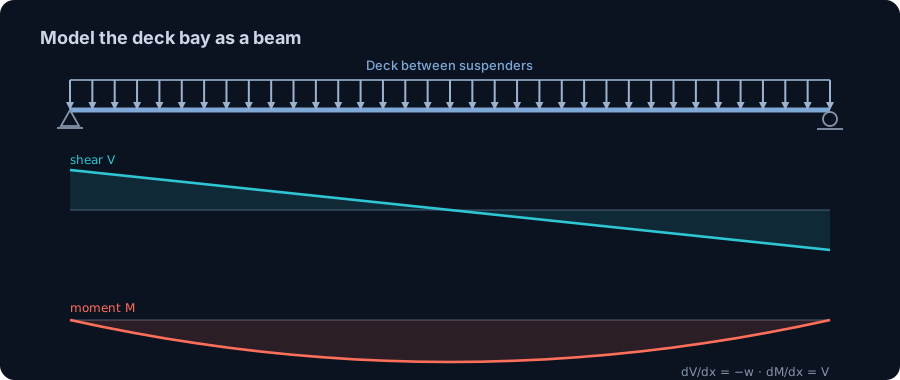
Here is the mental shift that unlocks the whole analysis: between suspender points, the deck and stiffening truss behave like a beam. A bay of deck spans horizontally from one line of suspenders to the next and resists load exactly the way a floor beam does, by developing internal forces along its length. Once you see the deck as a beam, every tool from a first structures course applies directly.
Two internal quantities describe that behaviour:
- Shear force, V, the internal vertical force that one slice of the deck transmits to the next. It is largest near the supports.
- Bending moment, M, the internal turning effect that puts one face of the deck in tension and the other in compression. It is what bends the beam and what the section must be strong enough to resist. In a simply supported span it peaks near midspan.
These two are tied together by two elegant relations that hold for any beam under distributed load w:
- dV/dx = −w, the slope of the shear diagram equals minus the load intensity.
- dM/dx = V, the slope of the moment diagram equals the shear.
In plain language, the slope of one diagram is the height of the next. Where the shear passes through zero, the moment reaches a peak. Master those two lines and you can sketch the internal forces of the Golden Gate deck, or any beam, from memory. We unpack them fully in shear force and bending moment diagrams. The best way to feel it is to draw one yourself, so our free beam calculator plots V, M, and deflection in real time, and in the next three sections we run exactly that engine on the deck.
Worked example 1: the deck under its own weight
Every bridge starts by holding itself up. Before a single car crosses, the stiffening truss and floor system carry a continuous, ever-present load, their own dead weight, spread evenly along the span. In beam terms that is a uniformly distributed load (UDL), and it is the cleanest place to see the deck behave as a beam.
We built a representative modern-steel model of a deck floor-beam in CalcSteel and solved it with the real FEM engine. To be precise, this is not one of the 1937 members. It is a deep steel girder, a W690x125 (grade fy = 250 MPa, E = 200 GPa), chosen to reproduce, in numbers you can check, how the deck works structurally.
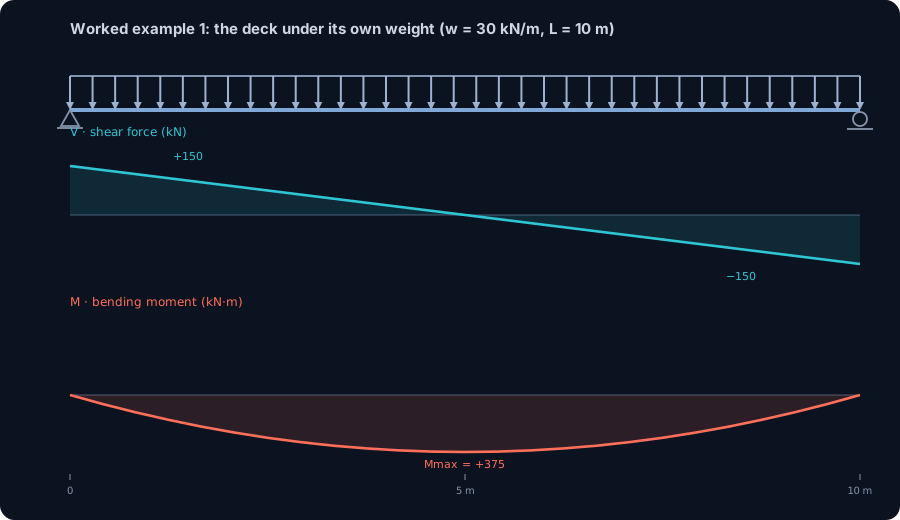
The model: simply supported (a pin and a roller), span L = 10 m, uniform load w = 30 kN/m. Here is what the engine returned, and every value matched closed-form beam theory to three decimals:
- Reactions: R = 150 kN at each support, simply the total load wL = 300 kN split between two symmetric supports.
- Shear: a straight line from +150 kN at the left support, through zero at midspan, to −150 kN at the right. Peak Vmax = 150 kN, always at the supports, exactly where the deck hands its load off to the suspenders.
- Bending moment: a smooth parabola, zero at both ends and peaking at midspan. Mmax = +375.0 kN·m, matching the textbook wL²/8 = 30 × 10² / 8 = 375 kN·m to the last digit.
- Deflection: the midspan sag is 16.688 mm, tracking the classic 5wL⁴/384EI.
Two ideas are worth locking in. First, shear is largest at the supports, moment is largest at midspan, they peak in different places, which is why you always draw both diagrams. Second, the moment is what sizes the steel: 375 kN·m is the demand just to hold the deck level. When the live load arrives in the next example, that number moves.
Worked example 2: a heavy load crosses
Self-weight is polite: it sits still and spreads itself out. Traffic does not. What matters structurally is that vehicle loads are concentrated and they move, and a moving concentrated load asks a very different question of the deck than a smeared uniform one.
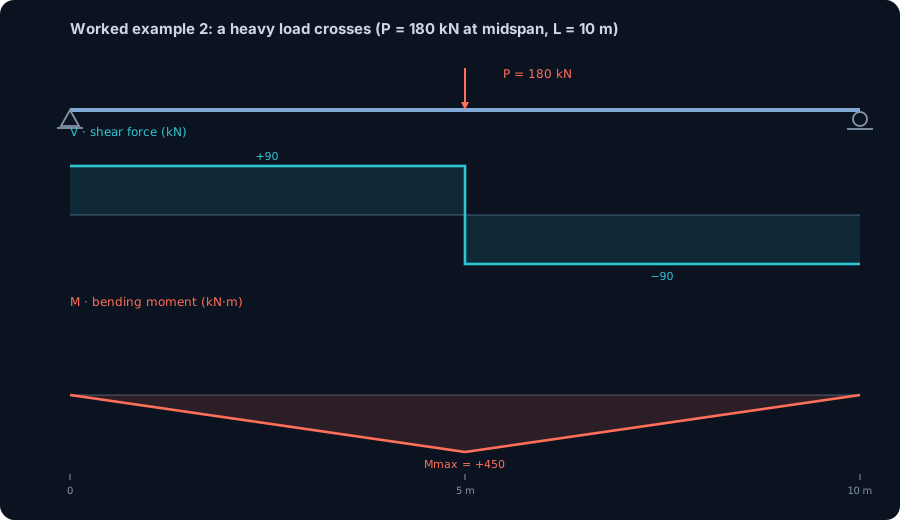
So we kept the exact same span and section, the W690x125, L = 10 m, simply supported, and replaced the distributed load with a single concentrated live load of P = 180 kN parked at midspan, the worst position for bending. Again the FEM engine solved it and matched closed-form theory to three decimals:
- Reactions: R = 90 kN at each support (the 180 kN splits evenly by symmetry).
- Shear: constant at +90 kN from the left support to midspan, then −90 kN through to the right. Vmax = 90 kN.
- Bending moment: a sharp triangle, zero at the ends, climbing to a single peak directly under the load. Mmax = +450.0 kN·m, exactly the textbook PL/4 = 180 × 10 / 4 = 450 kN·m.
- Deflection: 16.020 mm at midspan, tracking PL³/48EI.
Now put the two examples side by side, because this comparison is the engineering heart of the deck:
- Self-weight UDL (SIM-1): Mmax = 375 kN·m, from a total load of 300 kN.
- Single crossing load (SIM-2): Mmax = 450 kN·m, from a total load of only 180 kN.
The lighter concentrated load produces the LARGER peak moment, 450 versus 375 kN·m, even though its total force is barely more than half the self-weight. That is not a fluke: a load focused at one point drives moment up faster than the same total spread along the span, and because it moves, it drags its peak across the deck. Moving concentrated loads govern the deck, which is precisely why a suspension deck cannot be a limp ribbon hanging from cables, and why the stiffening truss exists to catch each wheel and spread it to many suspenders at once.
Draw your own deck: the live beam calculator
You have just watched two beams solved to three decimals, now solve your own. The calculator below is the same idea we used for SIM-1 and SIM-2: place your supports, add a uniform or point load, and read the shear, bending moment, and deflection in real time as you change the numbers.
Try the experiment that makes this section click:
- Set a 10 m span, simply supported, and add a 30 kN/m uniform load. Watch the moment peak settle at 375 kN·m (wL²/8) at midspan.
- Now clear it, drop a single 180 kN point load at midspan, and watch the peak jump to 450 kN·m (PL/4), the concentrated load winning, just as it did above.
- Slide that point load along the span and watch the moment diagram change shape. That is a moving live load, live in your browser.
It is free, it runs right here in the page, and the math needs no login. If you would rather open it full-screen with more options, the standalone beam calculator is one click away, and every diagram it draws comes from the same real FEM engine behind the worked examples on this page.
Max moment
45 kN·m
Max shear
30 kN
Max deflection
10.55 mm
= L/569
Bending stress σ
84.4 MPa
σ = M/Sx
Utilization
44.0%
NBR 8800 · δ ≤ L/250
Geometry & supports
Section
Ix 7999 cm⁴ · Sx 533 cm³ · 42.2 kg/m
Point loads (↓ positive)
None — add as many as you need.
Distributed loads (uniform or trapezoidal)
Model sketch
Diagrams — free PNG / SVG / CSV export, no watermark
Step-by-step — the calculation memory of YOUR beam
IPE 300 · L = 6 m · fy = 250 MPa
1. Reactions (equilibrium of the solved FEM model)
ΣFy = 0 · ΣM = 0
R_A = 30 kN · R_B = 30 kN
2. Peak shear (read from the SFD)
Vmax = |V(x)|max
Vmax = -30 kN @ x = 6 m
3. Peak moment (read from the BMD)
Mmax = |M(x)|max
Mmax = 45 kN·m @ x = 3 m
4. Peak deflection
EI = 15998 kN·m² (E = 200 GPa)
δmax = 10.55 mm @ x = 3 m = L/569
5. Elastic bending stress
σ = Mmax / Sx = 45.00 × 10³ / 533.3
σ = 84.4 MPa
6. Bending check — both codes, side by side
NBR 8800: σ ≤ fy/1.10 = 227.3 MPa · AISC 360: σ ≤ 0.90·fy = 225 MPa
NBR 37.1% PASS · AISC 37.5% PASS
7. Deflection check (serviceability — code-independent)
δ ≤ L/250 = 24 mm
10.55 mm / 24 mm = 44.0% PASS
Recomputed live from the current inputs by the direct-stiffness FEM engine — change any load and every step updates. Reproduce it by hand with the formulas in the sections below.
Lightest catalog profiles that pass (974 flexural candidates · NBR 8800)
| Profile | Std | Weight | Total steel | σ util | δ util | |
|---|---|---|---|---|---|---|
| W310x21 | AISC | 21 kg/m | 126 kg | 83% | 98% | |
| VS 300x23 | BR | 22.6 kg/m | 136 kg | 71% | 84% | |
| U 300x90x6.3 | BR | 23.1 kg/m | 139 kg | 82% | 98% | |
| U 300x100x6.3 | BR | 24.1 kg/m | 145 kg | 77% | 91% | |
| VS 250x25 | BR | 24.6 kg/m | 148 kg | 70% | 100% |
Elastic bending (σ = M/Sx vs fy/γa1, γa1 = 1.10 — NBR 8800) + deflection screening of the full flexural catalog. Lateral-torsional buckling, shear and local buckling are NOT checked here — run the full NBR 8800 / AISC 360 verification in the 3D editor.
Deflection theory, depth, and the slender deck
A bridge that is strong enough is not automatically a bridge that is stiff enough. Strength keeps the steel from yielding; stiffness keeps the deck from deflecting and swaying so much that it becomes unusable, or unstable. On a suspension span this distinction becomes the central design problem, and its answer on the Golden Gate was Moisseiff's deflection theory.
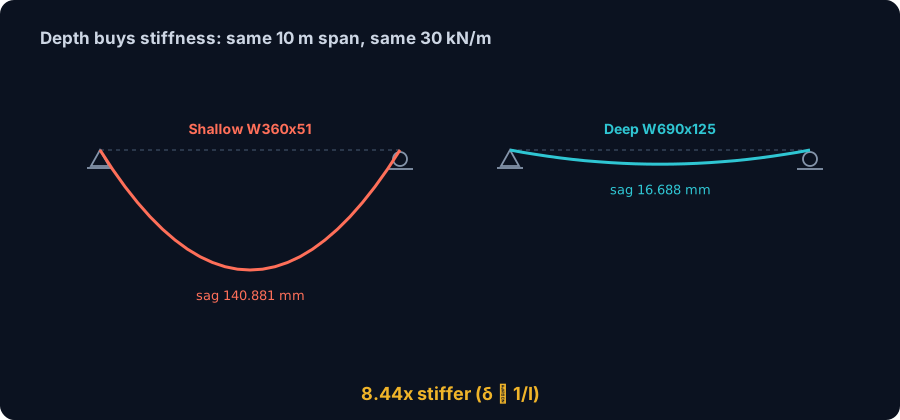
Let the engine make the point in numbers. We take the same 10 m span and the same self-weight of 30 kN/m as in Worked Example 1, and change only one thing, the depth of the section:
- Shallow girder, W360x51 (moment of inertia Ix = 13,864 cm&sup4;): midspan deflection 140.881 mm.
- Deep girder, W690x125 (Ix = 117,039 cm&sup4;): the same load, the same span, deflects only 16.688 mm.
The deep section deflects 8.44x less. That is not the strength of the steel doing the work, both sections are the same grade. It is geometry: the moment of inertia of the deep girder is 8.44x larger, and elastic deflection is inversely proportional to it, delta is proportional to 1/I. Depth is the cheapest stiffness you can buy, because moving material away from the neutral axis grows I with the square of the distance.
Here is the problem, and the genius of the Golden Gate. On a 1,280 m span you cannot make the deck deep enough to control deflection by depth alone, a truss that stiff would be impossibly heavy. Older suspension theory forced a very deep, heavy stiffening truss anyway, which is what Brooklyn used on its far shorter span. Moisseiff's deflection theory broke that constraint: it accounted for the fact that the loaded cable itself, held in tension by the enormous dead weight of the deck, provides most of the system's stiffness. The heavier the dead load, the tauter the cable, the stiffer the whole span. That let the deck stay slender, because the cables, not the truss, carry the burden of stiffness.
It was a brilliant bet, and it had a limit. Push slenderness too far and the deck becomes aerodynamically lively, which is exactly what destroyed the first Tacoma Narrows Bridge in 1940, another Moisseiff deflection-theory design. The Golden Gate did not collapse, but on 1 December 1951 a storm proved the deck was too flexible, undulating enough to force the bridge closed. The answer was not more depth but more triangulation: a lower lateral bracing system added in 1953 to 1954 that gave the deck the torsional stiffness deflection theory had left thin. Strength and serviceability are two separate checks, and the wind is the reason the second one is never a formality.
Worked example 3: continuity over a tower
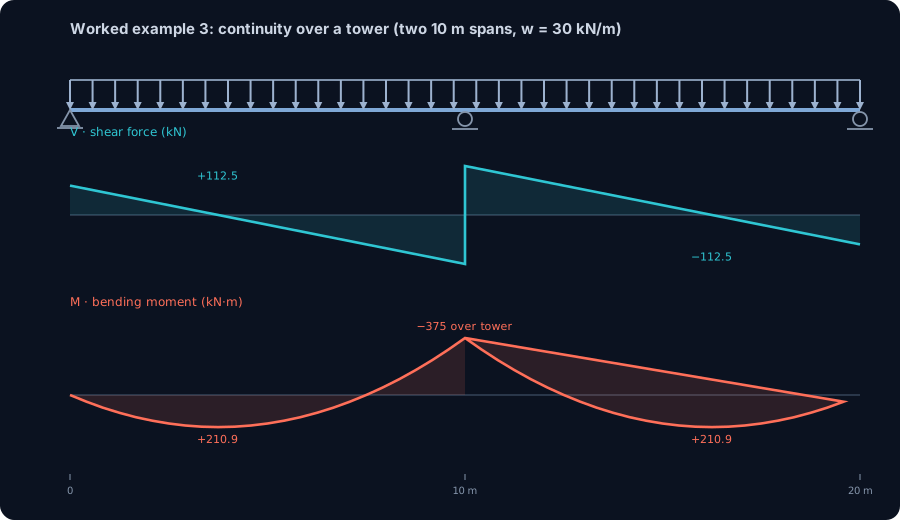
So far the deck has been chopped into single, simply-supported spans, each solvable with nothing more than statics. The real bridge is not built that way. The stiffening truss runs continuous across the towers, and continuity changes the mechanics in a way you cannot capture one span at a time. To show it, we model two 10 m spans of representative deck sharing a single interior support over the tower, still carrying the self-weight of 30 kN/m.
The moment the deck becomes continuous, it becomes statically indeterminate. There are now more unknown reactions than equilibrium equations can supply, so ΣF and ΣM alone cannot finish the job. You need a compatibility condition, the deck must stay continuous over the support, and that is where hand methods start to hurt and a FEM engine simply solves the whole system at once. CalcSteel returns:
- Hogging moment over the tower support: −375.0 kN·m (= −wL²/8). The deck bends the other way here, tension on top, compression on the bottom, the reverse of a simple span.
- Sagging moment in each span: +210.9 kN·m (= 9wL²/128).
- Reactions: 112.5 kN at each outer support and 375 kN at the interior tower support.
Two results are worth pausing on. First, the interior support carries far more than the outer ones, 375 kN versus 112.5 kN, because continuity draws load toward the stiff support over the tower. That is precisely what a tower wants: it is the strong point, and continuity feeds the load to it. Second, compare the peak span moment here, +210.9 kN·m, with the +375.0 kN·m the identical span produced when simply supported (Worked Example 1). Same steel, same load, but continuity has redistributed the demand, pulling moment out of the span and parking it as hogging over the support. The structure shares the work instead of concentrating it.
This is one of the quiet superpowers of a continuous stiffening truss: it makes the deck behave as one cooperative system rather than a row of independent beams, so no single midspan section has to survive the full simple-span moment. The catch is that the hogging region over the tower now needs its own attention, the top of the deck is in tension there, which is why continuous structures are detailed carefully over their supports.
Demand, capacity, and the margin of safety
Every number so far has been a demand, how hard the load pushes on the deck. The other half of engineering is capacity, how hard the section can push back before it yields. The gap between them, expressed as a ratio, is the factor of safety, and it is why a bridge from 1937 is still carrying traffic.
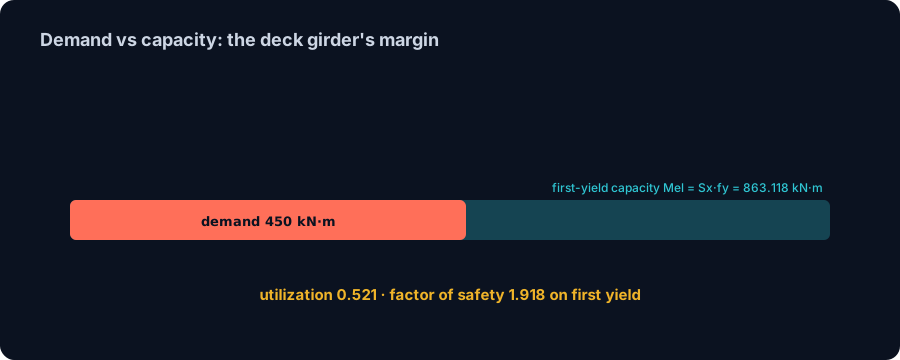
Take our deep deck girder, the W690x125. Its elastic section modulus is Sx = 3,452.5 cm³, and at a yield strength of fy = 250 MPa the first-yield moment capacity is:
- Mel = Sx · fy = 863.1 kN·m, the moment at which the outermost fibre first reaches yield.
Now set that against the worst demand we found, the moving concentrated load of Worked Example 2, 450 kN·m:
- Utilization = 450 / 863.1 = 0.52. The section works at 52% of its first-yield capacity.
- Factor of safety on first yield = 863.1 / 450 = 1.92. The deck could take almost twice its governing moment before the steel even begins to yield, and first yield is still a long way from collapse, because a ductile steel section keeps carrying load well past it.
That is a deliberate margin. It exists not because the engineer expects the design load, but because of everything the engineer cannot fully predict: overload, impact, corrosion over a century, fabrication scatter, and, on a suspension span, wind. If you want the reasoning behind numbers like this, see how factors of safety work and the role of the section modulus in turning a shape into a moment capacity.
The Golden Gate carries the same philosophy into every element, and it has kept paying dividends. The bridge has been maintained and reinforced continuously, and since 1997 it has been undergoing a major multi-phase seismic retrofit to bring an 1930s structure up to modern earthquake demands. The margin is the point: it is there for the loads nobody drew on the original plans.
Modeling a steel structure in CalcSteel
Every number in this article came out of the same place: CalcSteel's real FEM engine, the shipping app.engine.solver that assembles the stiffness matrix, applies your loads, and solves for displacements and internal forces. It is not a lookup table or a hand-formula wrapper. It is a genuine finite-element solver, and each determinate result you have seen (reactions, shear, moment, deflection) was validated against closed-form theory to three decimals before we published it.
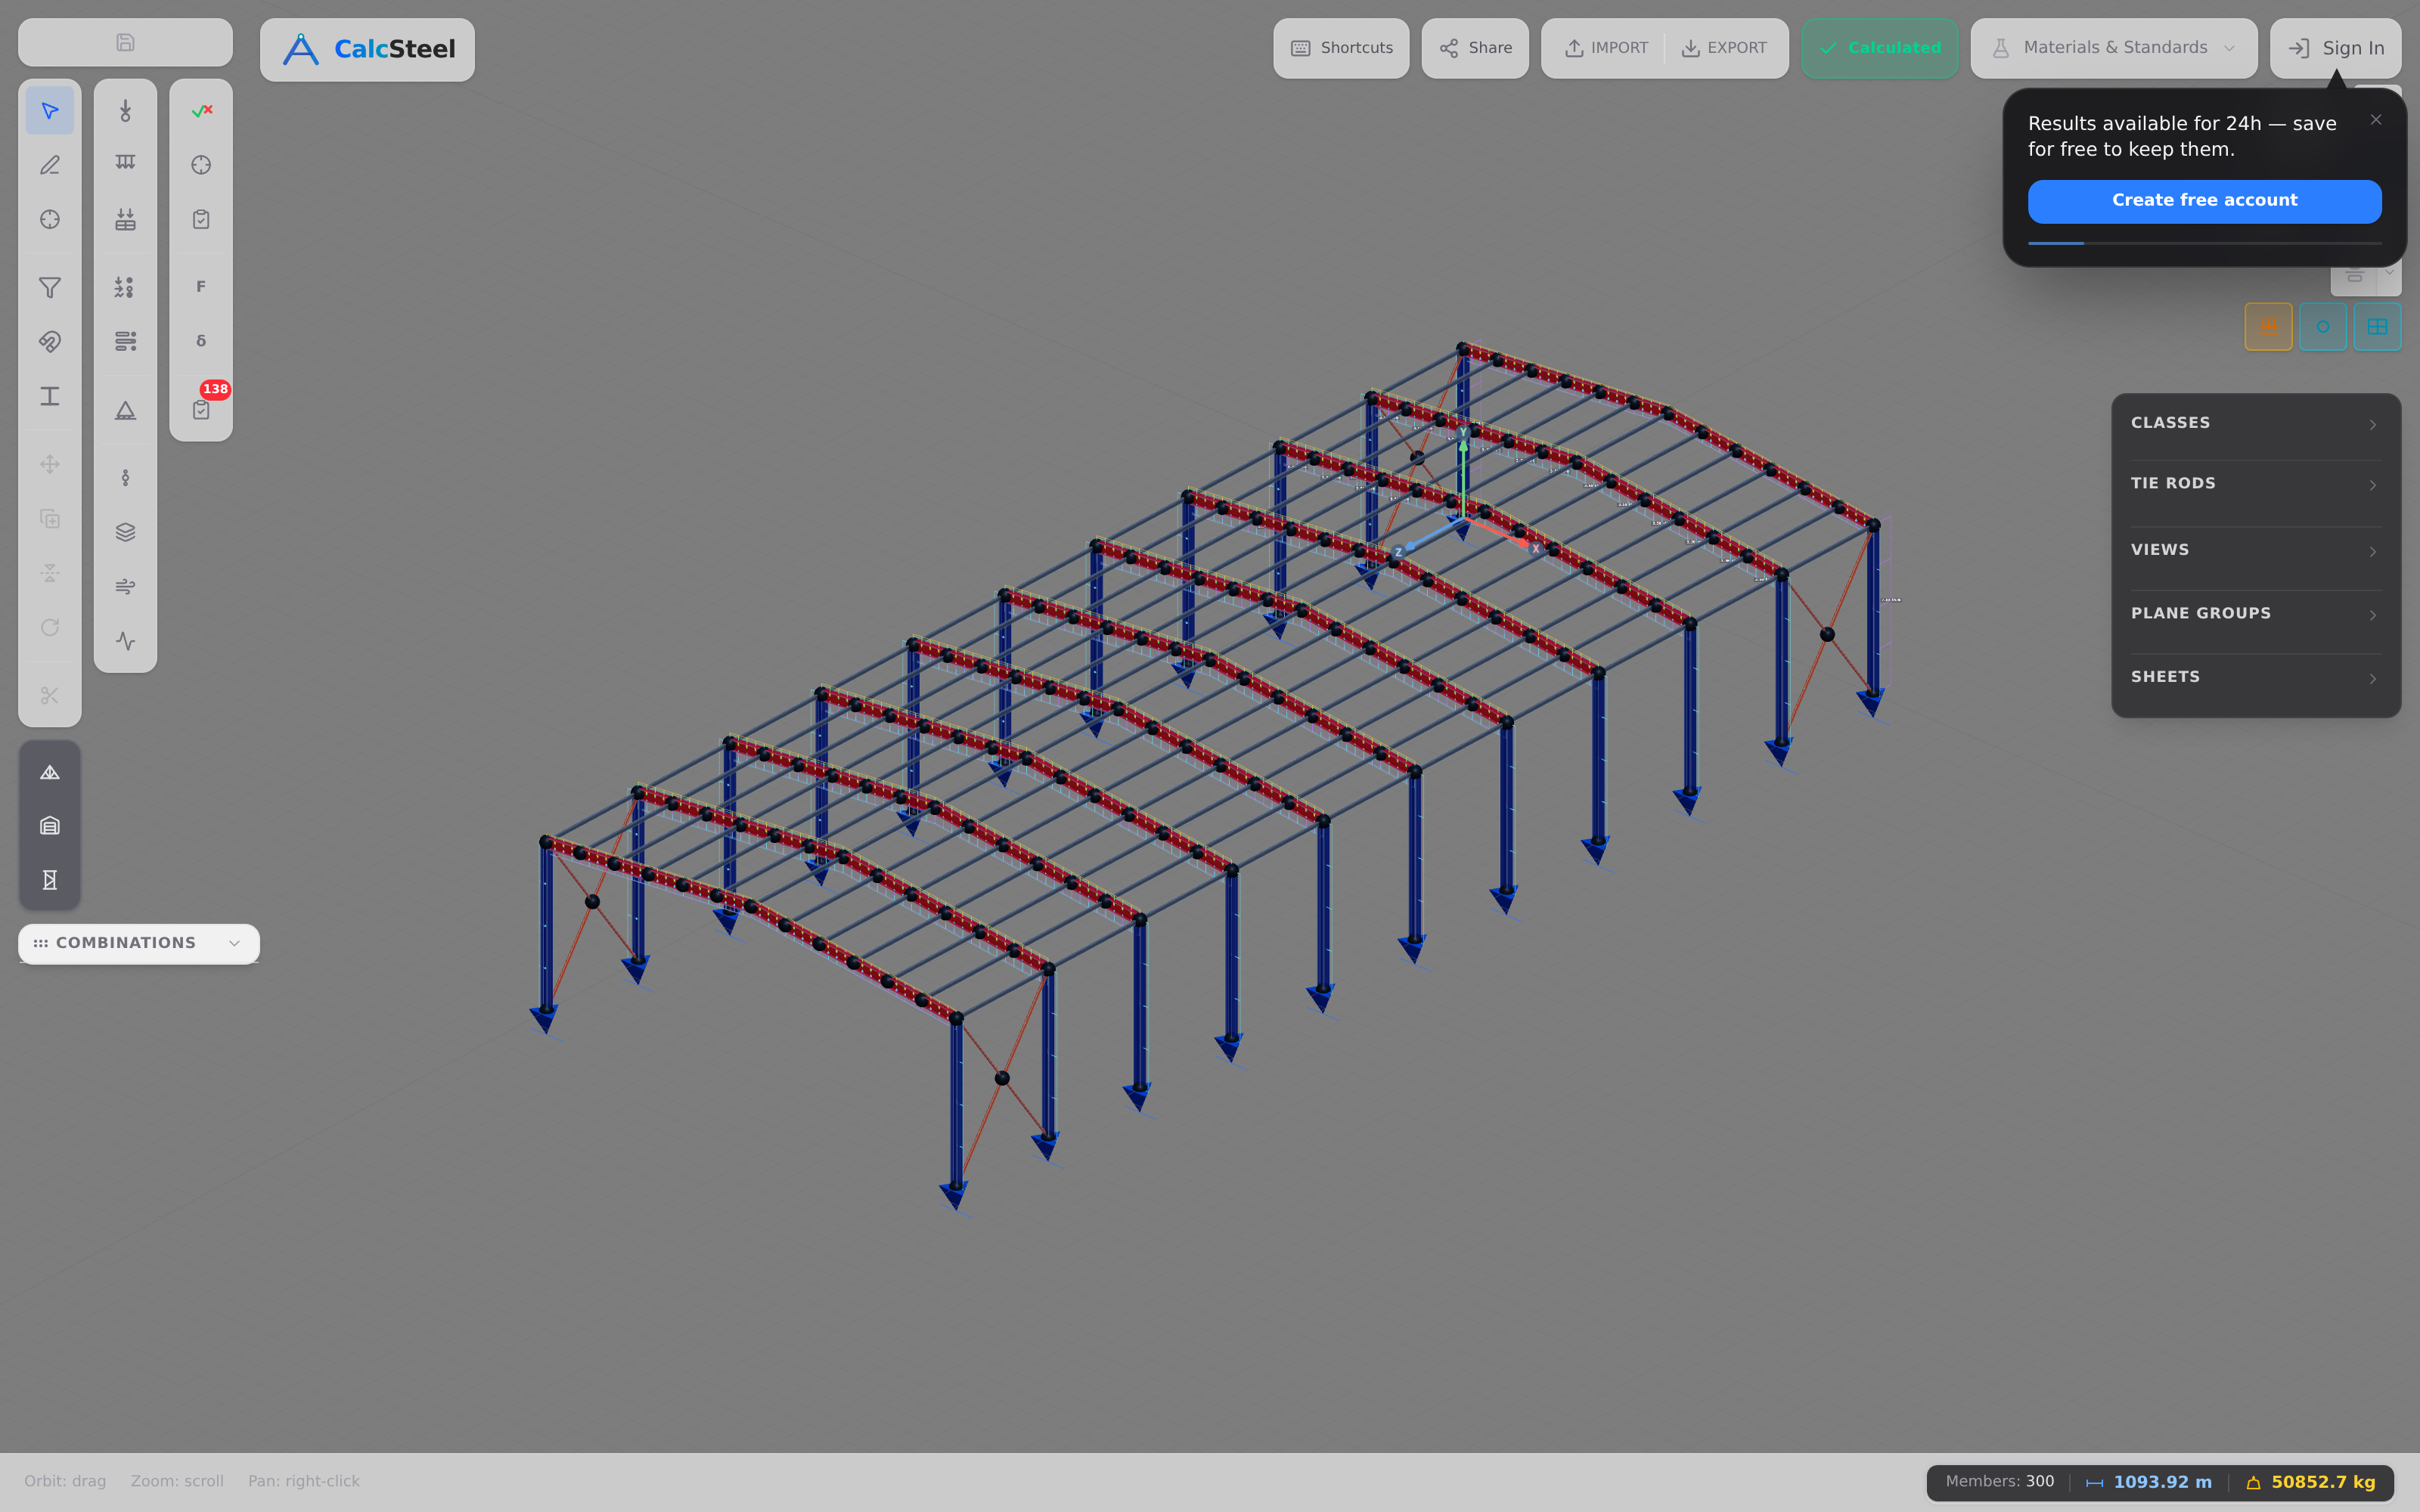
The honest caveat first: the screenshot below is a representative modern steel frame, not the 1937 Golden Gate itself. We are not claiming to have modeled Moisseiff's cables and truss. What we are showing is the workflow, the same engine, the same diagrams, the same verification logic that let us reproduce how the deck behaves as a beam.
The workflow is short and it is the same one you would use for a warehouse portal, a mezzanine, or a footbridge:
- Build the geometry. Drop nodes, connect members, assign a profile. For our deck examples that profile was a W690x125 deep girder, grade fy = 250 MPa, E = 200 GPa.
- Apply supports and loads. Pin and roller for a simply-supported span, a uniform line load w for self-weight, a concentrated P for a crossing load, a continuous line over two spans for the tower-continuity case.
- Run the FEM engine. The solver returns reactions, the shear diagram, and the bending-moment Mz diagram you have been reading, with the sagging +375 kN·m, +450 kN·m, and the hogging −375 kN·m over an interior support.
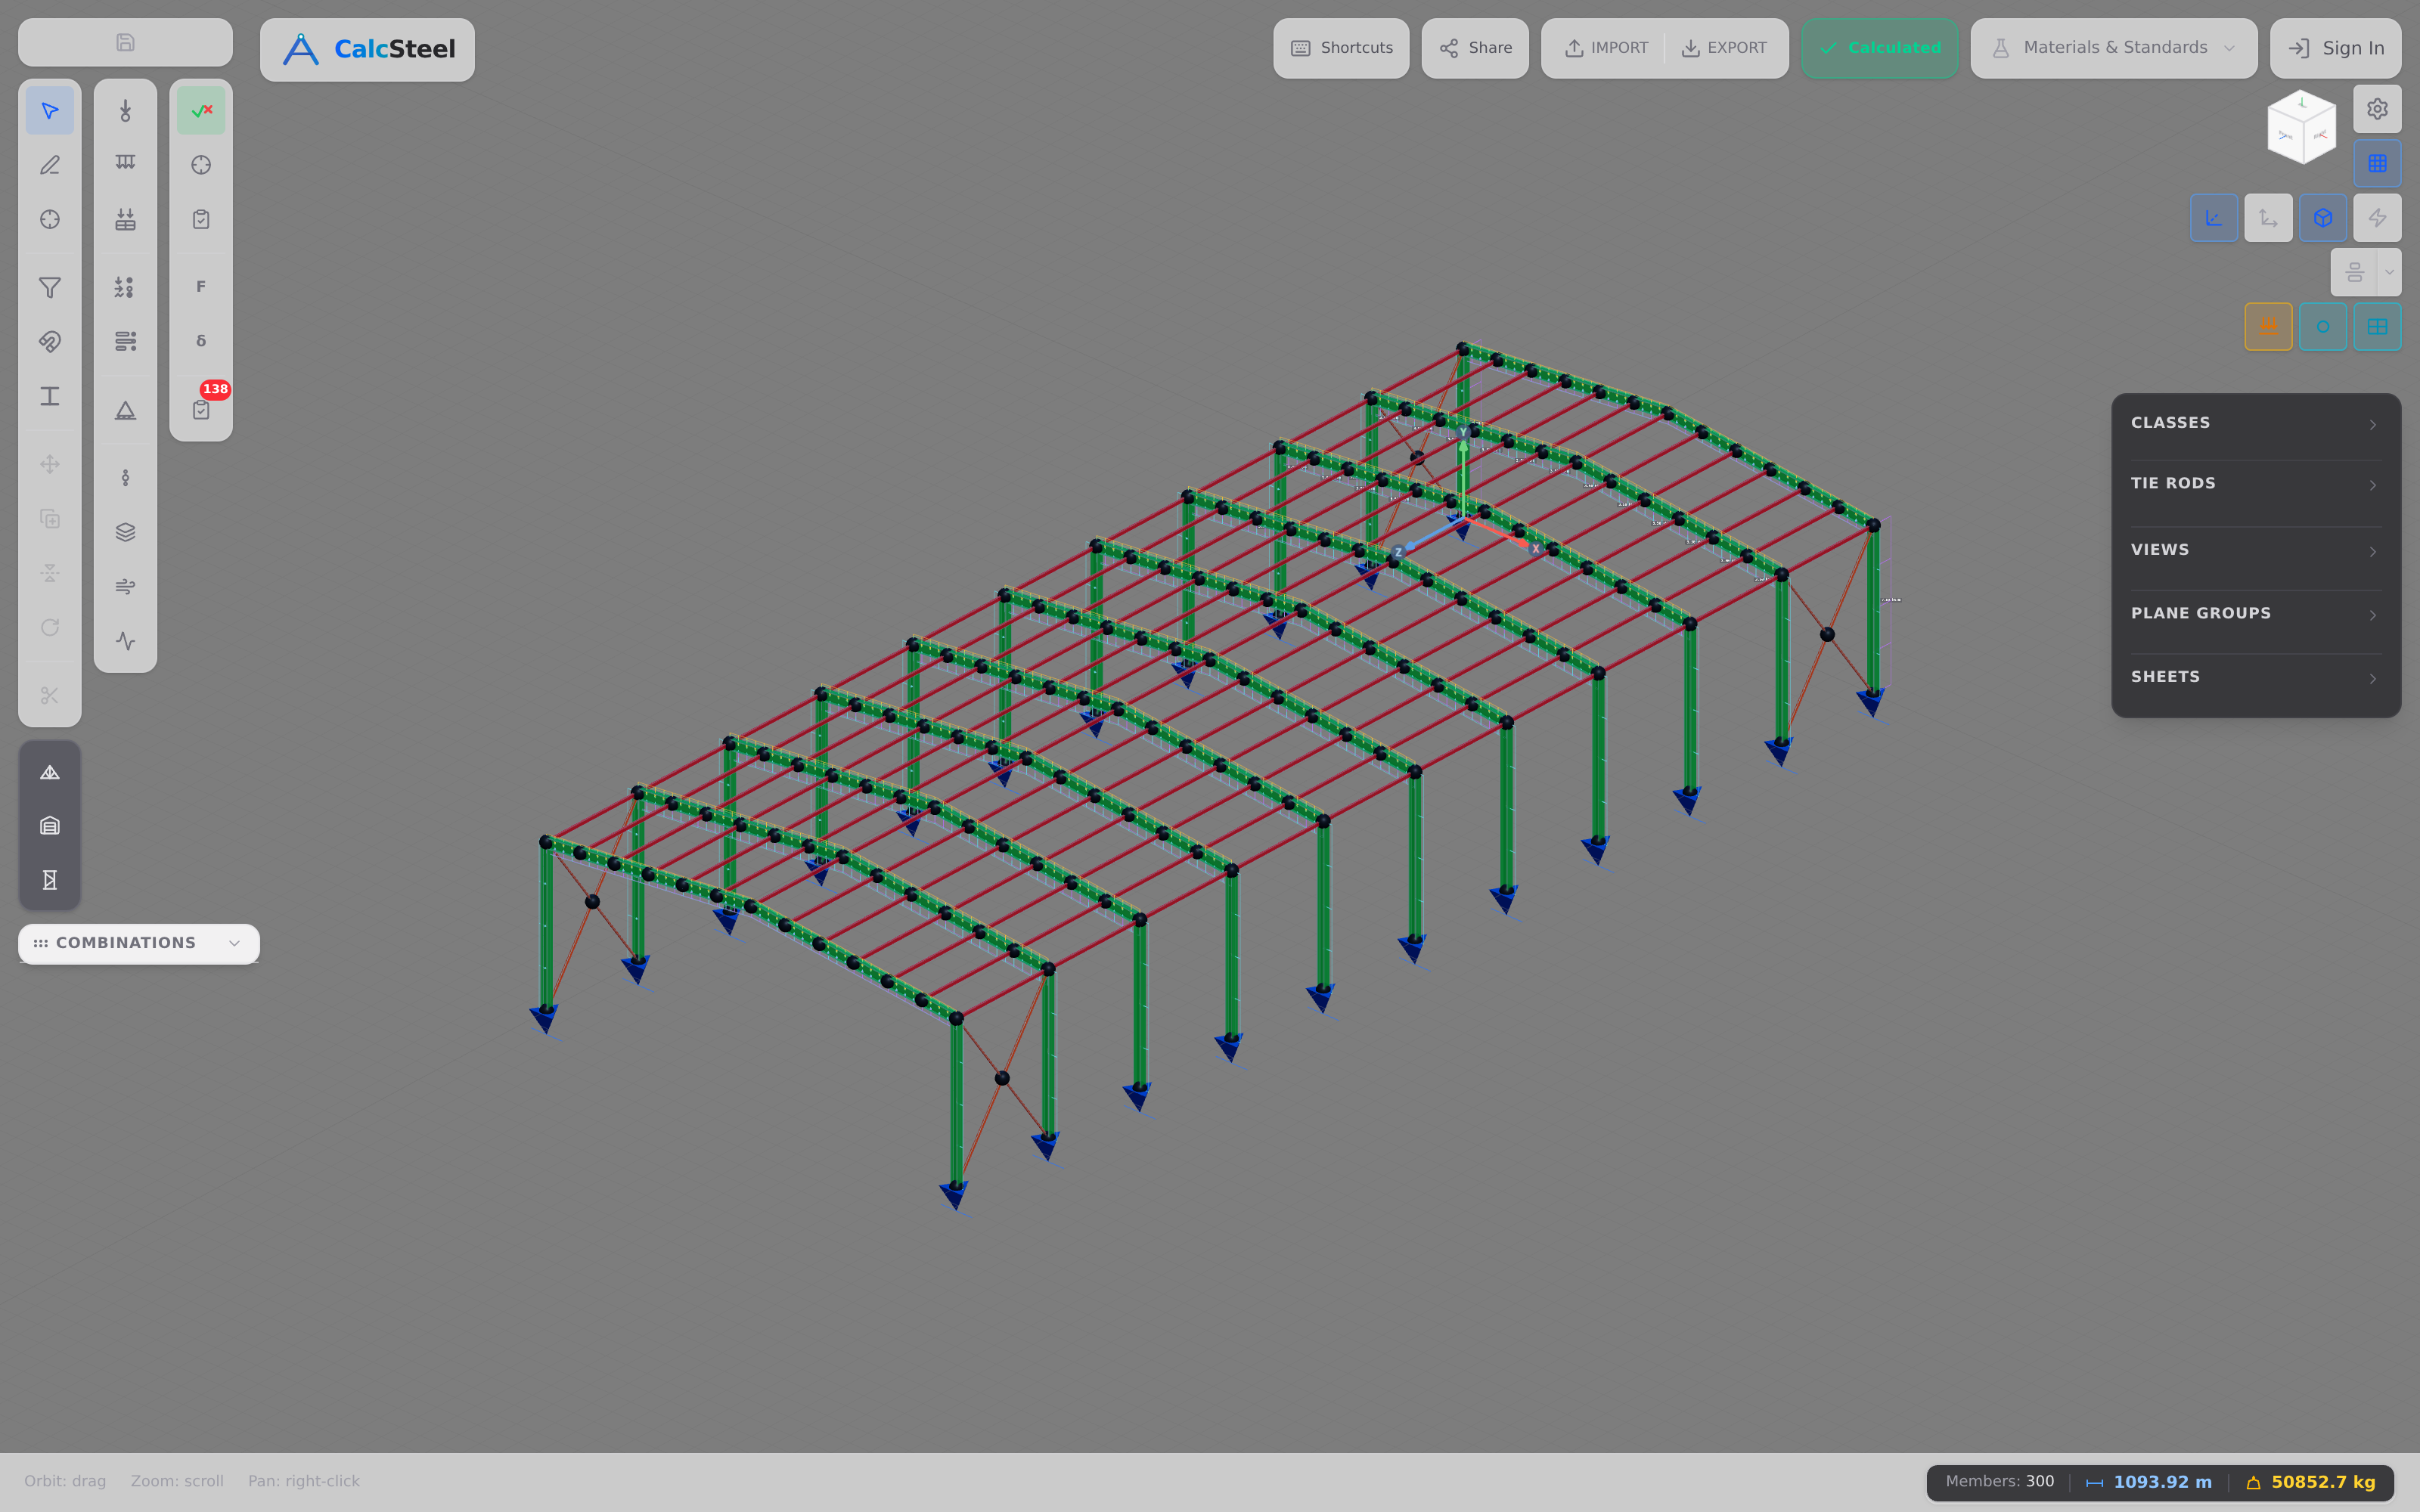
- Read the code-check colors. CalcSteel verifies each member and paints it by utilization. Our deck girder ran at 0.52 against first yield, comfortably inside capacity.
That is the whole loop: model, solve, verify, iterate. The bridge examples are a case study, but the engine is a general-purpose tool. You can open CalcSteel in your browser and build a steel structure of your own, the math runs free, right where you are, with no desktop install.
Engineering lessons and common mistakes
Strip away the towers and the International Orange and the Golden Gate is a lesson in a handful of principles that still govern every structure you will design. Here is the checklist, each tied back to something we computed or verified.
- Stiffness is not strength. A member can be strong enough to never yield and still be unacceptably flexible. Our shallow W360x51 and deep W690x125 had the same job, but the shallow one deflected 140.881 mm versus 16.688 mm, 8.44x more, because deflection scales with 1/I, not with strength. The 1951 deck motion and the Tacoma Narrows collapse are the same lesson at bridge scale.
- Trust the whole system, not one member. Deflection theory works because the cables' dead-load tension stiffens the span. The stiffness lives in the loaded system, not in any single beam, which is how a 1,280 m deck could stay slender. Design the load path, not lucky members.
- Moving concentrated loads govern. The deck's own weight produced 375 kN·m. A single 180 kN load crossing at midspan produced 450 kN·m, a higher peak from a far lighter total. This is why bridges are designed for moving vehicles, and why the stiffening truss exists to spread those point loads.
- Continuity redistributes moment. Make the deck continuous over a tower and the peak sagging moment drops from 375 to +210.9 kN·m, at the cost of a hogging −375 kN·m over the support. The structure is now statically indeterminate, and a FEM engine solves it instantly.
- Factors of safety exist for the unknowns. Our deck girder ran at utilization 0.52, a factor of 1.92 on first yield, with ductile reserve beyond. Never design to exactly 1.0, because wind, corrosion, and the load you did not imagine are all real.
Frequently asked questions
Is the Golden Gate a suspension or a cable-stayed bridge? It is a pure suspension bridge. Two main cables in a catenary curve hang the deck through vertical suspenders, and there are no diagonal stay cables. That is the key difference from the Brooklyn Bridge, which is a hybrid of suspension, stays, and a deep truss.
What is deflection theory and why did it matter here? Deflection theory accounts for the stiffening effect of the main cable's dead-load tension. Because the loaded cable resists deflection, the deck itself can be lighter and more slender than older theory allowed, which is what made a 1,280 m span practical. Its limit is aerodynamic: too slender a deck can move dangerously in wind, as the 1951 storm showed.
What is the Golden Gate Bridge made of? The towers, deck, and stiffening truss are steel, painted International Orange. The two main cables are bundles of galvanized steel wire, about 27,572 wires each, and the anchorages that hold them are massive concrete blocks.
Key takeaways
The Golden Gate Bridge is a pure suspension span held up by an idea as much as by steel: Leon Moisseiff's deflection theory, which let a 1,280 m deck stay slender because the cables carry the stiffness. Ninety years on, the engineering that makes it stand is the same engineering you can compute today.
- It is a pure suspension system. Two cables in tension, two 227 m steel towers in compression, a deck in bending, and no diagonal stays. It was the world's longest span at its 1937 opening and held the record for 27 years.
- The deck behaves as a beam. Under self-weight our representative girder saw +375 kN·m (wL²/8) and deflected 16.688 mm; a 180 kN crossing load pushed the peak to +450 kN·m (PL/4). Moving concentrated loads govern.
- Depth equals stiffness, until you run out of depth. A deep W690x125 deflected 8.44x less than a shallow W360x51 under identical load. On a 1,280 m span you cannot buy enough depth, so deflection theory let the cables supply the stiffness instead.
- Continuity and indeterminacy need FEM. A two-span continuous deck gives −375 kN·m of hogging over the tower and +210.9 kN·m in the spans, instant with a real solver.
- Safety factors are for the unknowns. Our deck girder ran at utilization 0.52 (1.92 on first yield), and the 1951 wind is exactly the kind of unknown the margin exists to survive.
Now build it yourself. Open the free beam calculator and drive the shear, moment, and deflection in real time, no login for the math. When you want the full FEM workflow with member verification, CalcSteel is genuinely free to start in your browser, never a countdown trial but a real free plan with live calculators. And if you are a student, our education offer is free, so you can bring the engineering behind the world's most famous bridge into your own projects.
Sources
Try CalcSteel for free
Model, analyze and design steel structures in your browser. No install, no signup.
Open the 3D editor