Stress Concentration Factors: the Hole in the Flange and the Number the Textbook Gives You

Drill a hole in a steel flange and the elastic peak stress at its edge can be two or three times the nominal stress. The textbook gives you a chart, a factor Kt, and a frightening number. Then you run the steel check and it passes with room to spare. This guide reconciles the two: what the stress concentration factor really measures, why a ductile steel member under static load is not designed around it, and the cases where the peak is exactly what breaks the part.
Key takeaways
- A stress concentration factor Kt = σmax / σnom is purely geometric and elastic. It depends on the shape of the discontinuity and the reference area, not on the material or the load level.
- For a small circular hole in a wide plate the classic value is Kt = 3.0 (Kirsch). In a finite width flange it drops: for a 22 mm hole in a 100 mm width, Kt ≈ 2.47 referenced to the net section.
- In the worked flange the net nominal stress is 128 MPa but the elastic peak is 317 MPa, above the yield stress of ordinary structural steel. The peak is real, but it is local and it is elastic theory only.
- Ductile steel yields at the hole edge and redistributes. Static member strength is set by the net section reaching Fu (rupture) or the gross section reaching Fy (yielding), not by the peak. That is why AISC 360 and NBR 8800 carry no Kt term.
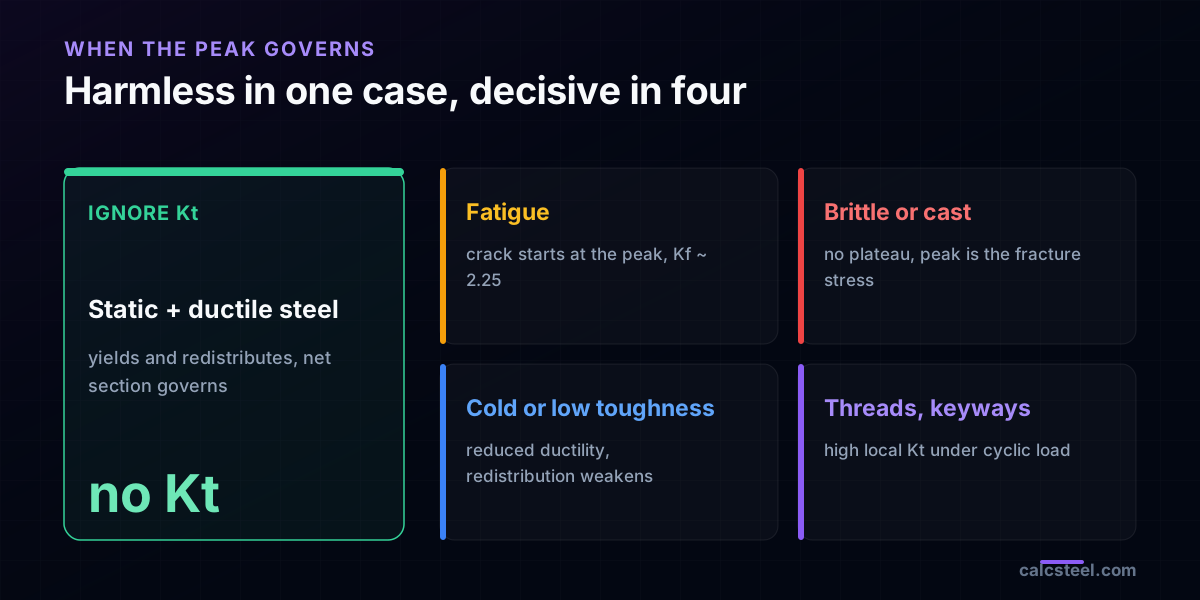
- The concentration governs when the material cannot redistribute: fatigue (the crack starts at the peak), brittle or cast material, low temperature or low toughness steel, and threaded parts.
The hole in the flange and the number the textbook gives you
A student drills a bolt hole in the tension flange of a steel member, opens the strength of materials textbook, and finds the rule for a discontinuity: σmax = K · σnom. The chart hands back a factor near 2.5, the arithmetic gives a peak stress around 300 MPa, and the conclusion looks unavoidable: the flange is overstressed.
The calculist at the next desk runs the same joint through a steel specification and it passes at roughly half capacity. Same geometry, same load, two verdicts that disagree by a factor of two. The gap is not an arithmetic slip. It is a difference in what each number is for.
This article walks the hole all the way through: what the stress concentration factor measures, where the famous value of 3 comes from, why a ductile steel member under a static load does not design around the peak, and the situations where that same peak is precisely the thing that breaks the part.
What a stress concentration factor actually is
A stress concentration factor is the ratio of the true local peak stress to a chosen nominal stress:
Kt = σmax / σnom
Three properties decide how you should read it. First, it is elastic. The theory behind Kt assumes linear elastic material all the way up, with no yielding anywhere. Second, it is geometric. Kt is fixed by the shape of the discontinuity and by ratios such as the hole diameter over the width, not by the steel grade or by how hard you pull. Third, it is tied to a reference area. σmax is a single physical value, but σnom is a convention, and a Kt only means something when you know whether its nominal stress was taken on the gross section or the net section.
The subscript t stands for theoretical. It is a property of the drawing. Later we meet Kf, the fatigue notch factor, which is smaller and does depend on the material.
Where the number comes from: the chart in the textbook
The value everyone remembers, Kt = 3, is the Kirsch solution of 1898. For an infinite plate with a small circular hole pulled in one direction, the tangential stress at the hole edge, on the axis perpendicular to the load, is exactly three times the far field stress. That is the origin of the 3, and it is referenced to the gross (far field) stress.
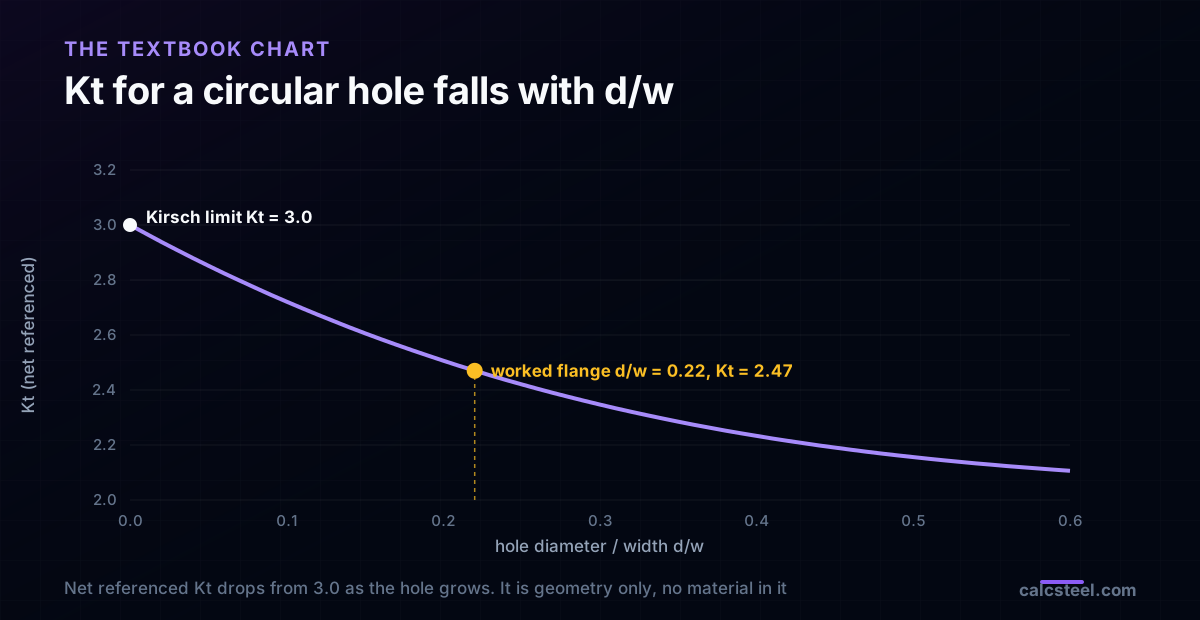
Real flanges are not infinite. For a finite width strip the chart in Peterson or Roark gives Kt as a function of the ratio d/w. Referenced to the net section, it falls from 3.0 as the hole grows:
Kt,net = 3.00 − 3.14(d/w) + 3.667(d/w)² − 1.527(d/w)³
| d/w | 0.10 | 0.20 | 0.22 | 0.30 | 0.40 |
|---|---|---|---|---|---|
| Kt,net | 2.72 | 2.51 | 2.47 | 2.35 | 2.23 |
The two conventions are linked by Kt,gross = Kt,net / (1 − d/w). Mixing them is the single most common error in reading the chart, and we return to it in the mistakes list. For the worked flange below, d/w = 0.22 and Kt,net = 2.47.
Worked example: a bolt hole in a tension flange
Take a flange plate 100 mm wide and 10 mm thick, with one standard 22 mm hole for an M20 bolt, carrying an axial tension of P = 100 kN.
| Quantity | Value |
|---|---|
| Gross area Ag = w·t | 1000 mm² |
| Net area An = (w − d)·t | 780 mm² |
| Net nominal stress σnom = P / An | 128 MPa |
| Ratio d/w | 0.22 |
| Kt (net referenced) | 2.47 |
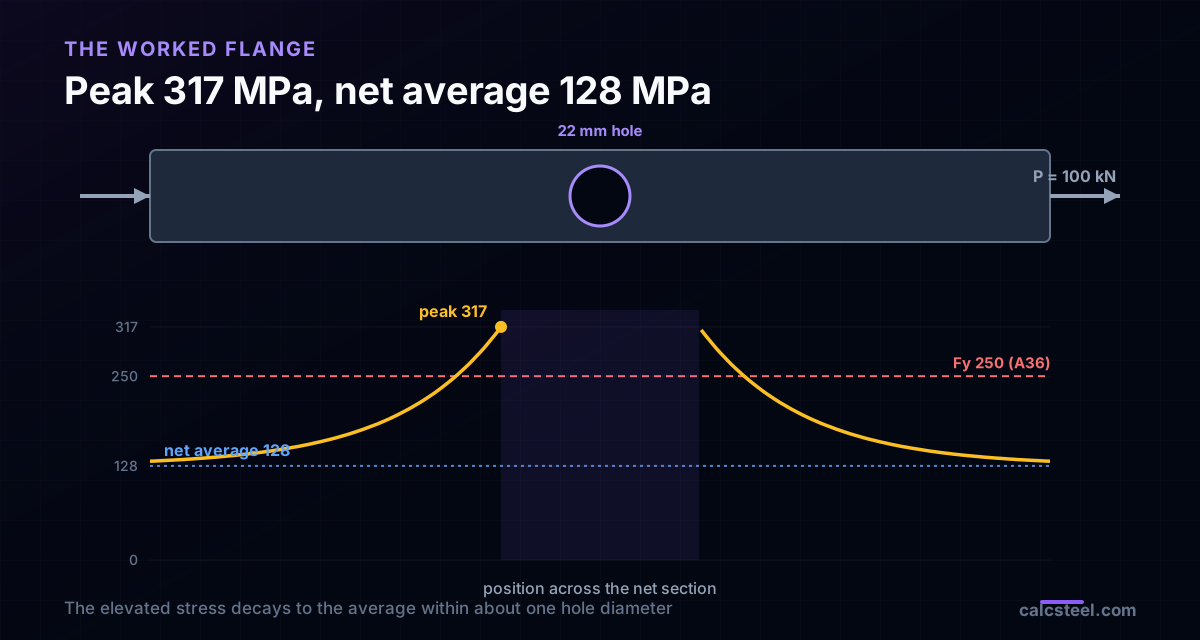
| Peak σmax = Kt · σnom | 317 MPa |
Now the tension. That 317 MPa peak is above the yield stress of ordinary structural steel: Fy = 250 MPa for ASTM A36, 275 MPa for EN S275. Read at face value, the hole edge is overstressed by a quarter. Yet the average stress across the net ligament is only 128 MPa, about half of yield. The member is nowhere near failing, and one edge fibre is nominally past yield. Both statements are true. The next two sections explain how.
The peak is real, and it is also local
The first temptation is to wave the peak away as a theoretical artifact. Do not. Photoelastic tests and finite element models both show the concentration plainly, and a fatigue crack really does start at the hole edge. The elastic peak is a genuine feature of the stress field.
Two facts put it in proportion. It is local: the elevated stress decays back to the nominal within roughly one hole diameter, so only a thin rim of material ever sees anything close to σmax. And it is elastic theory: Kt assumes the material stays linear all the way up to the peak, which stops being true the moment that rim yields. What happens after the rim yields is the whole story, and it depends on whether the material is ductile.
Why ductile steel is not designed around the peak
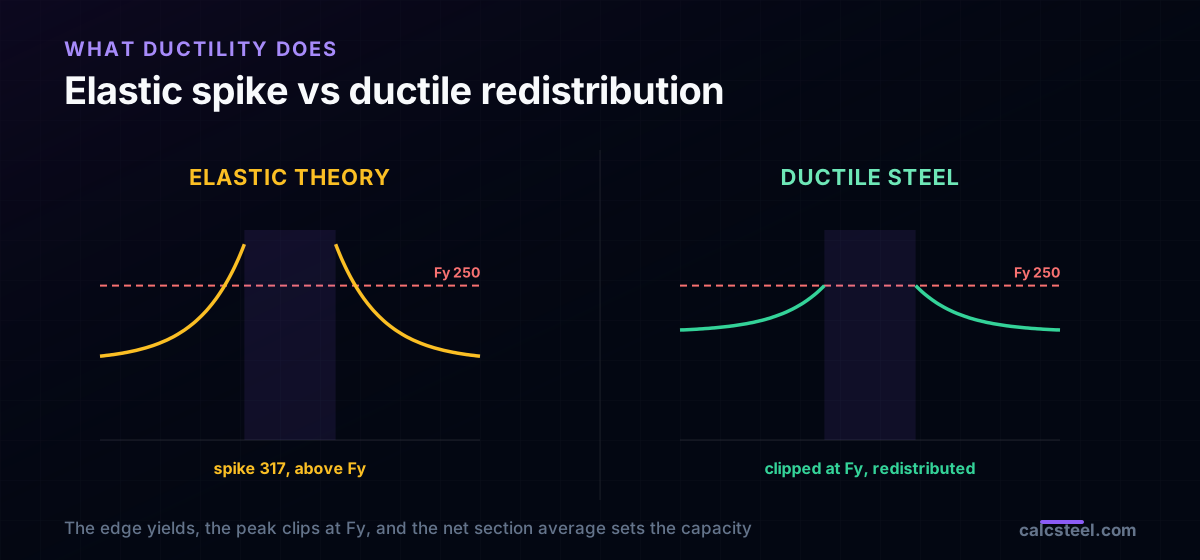
Raise the load on the worked flange. The hole edge reaches Fy first and yields. A ductile steel does not fracture there. It flows at roughly constant stress, the yield plateau, and sheds the extra force to the still elastic material beside it. The stress profile across the ligament flattens: the peak clips at Fy while the rest of the net section climbs to meet it.
By the time the member is near its limit, the net section is close to fully plastic and the average stress, not the vanished spike, sets the capacity. The governing quantity becomes the net section against Fu (rupture) or the gross section against Fy (yielding). This redistribution is the physical reason a steel specification folds the hole into an area rather than a Kt. Ductility is doing the work the factor seemed to demand.
What the steel code checks instead: net section, not peak
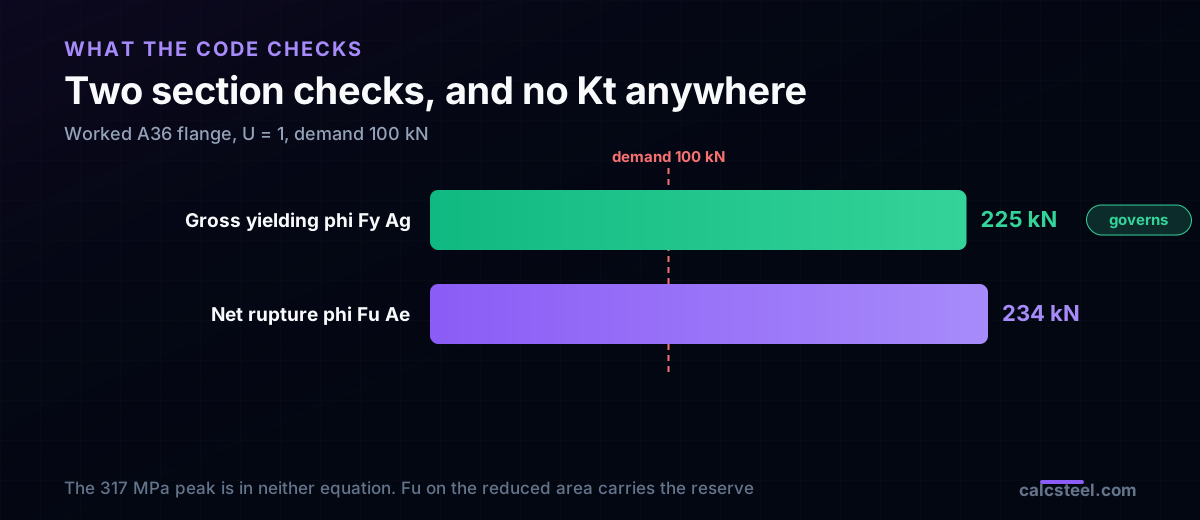
AISC 360, and equally NBR 8800 and Eurocode 3, size a tension member with two limit states, neither of which contains a stress concentration factor:
- Gross section yielding: φRn = φ Fy Ag, with φ = 0.90.
- Net section rupture: φRn = φ Fu Ae, with φ = 0.75 and Ae = U·An, where U captures shear lag.
For the worked A36 flange, with U = 1: gross yielding gives 0.90 × 250 × 1000 = 225 kN, and net rupture gives 0.75 × 400 × 780 = 234 kN. The capacity is 225 kN, governed by gross yielding, against a demand of 100 kN, so the flange runs at a utilisation of 0.44. The 317 MPa peak appears in neither equation. The φ factors and the use of Fu on the reduced area already carry the reserve the peak seemed to demand.
Where the concentration does govern
The redistribution argument rests on two conditions: the material must be able to yield, and the load must be static. Remove either one and the factor comes straight back.
- Fatigue. A cyclic load never lets the peak redistribute for good, and the crack nucleates exactly at the hole edge. Fatigue uses the notch factor Kf = 1 + q(Kt − 1), where q is the notch sensitivity, about 0.8 to 0.9 for structural steel and a hole this size, giving Kf ≈ 2.25 here. Steel codes deliver this through detail categories rather than Kf directly, but the physics is the peak.
- Brittle or cast material. No yield plateau, so nothing redistributes and the peak is simply the fracture stress.
- Low temperature or low toughness steel. Cold service or a high strength low ductility grade weakens the safe assumption of redistribution.
- Threads, keyways, sharp reentrant corners. High local Kt on details that usually also see cyclic load.
In each case the concentration is not a curiosity. It is the design driver.
Check it live: the nominal stress in the flange
The number the whole story multiplies is σnom, and that comes straight from the analysis: the axial force or the bending moment divided by the section that carries it. Model the member, read the stress the flange actually sees, and let the design report run the net section checks the way the code does, with no Kt multiplier bolted on top.
Max moment
45 kN·m
Max shear
30 kN
Max deflection
10.55 mm
= L/569
Bending stress σ
84.4 MPa
σ = M/Sx
Utilization
44.0%
NBR 8800 · δ ≤ L/250
Geometry & supports
Section
Ix 7999 cm⁴ · Sx 533 cm³ · 42.2 kg/m
Point loads (↓ positive)
None — add as many as you need.
Distributed loads (uniform or trapezoidal)
Model sketch
Diagrams — free PNG / SVG / CSV export, no watermark
Step-by-step — the calculation memory of YOUR beam
IPE 300 · L = 6 m · fy = 250 MPa
1. Reactions (equilibrium of the solved FEM model)
ΣFy = 0 · ΣM = 0
R_A = 30 kN · R_B = 30 kN
2. Peak shear (read from the SFD)
Vmax = |V(x)|max
Vmax = -30 kN @ x = 6 m
3. Peak moment (read from the BMD)
Mmax = |M(x)|max
Mmax = 45 kN·m @ x = 3 m
4. Peak deflection
EI = 15998 kN·m² (E = 200 GPa)
δmax = 10.55 mm @ x = 3 m = L/569
5. Elastic bending stress
σ = Mmax / Sx = 45.00 × 10³ / 533.3
σ = 84.4 MPa
6. Bending check — both codes, side by side
NBR 8800: σ ≤ fy/1.10 = 227.3 MPa · AISC 360: σ ≤ 0.90·fy = 225 MPa
NBR 37.1% PASS · AISC 37.5% PASS
7. Deflection check (serviceability — code-independent)
δ ≤ L/250 = 24 mm
10.55 mm / 24 mm = 44.0% PASS
Recomputed live from the current inputs by the direct-stiffness FEM engine — change any load and every step updates. Reproduce it by hand with the formulas in the sections below.
Lightest catalog profiles that pass (974 flexural candidates · NBR 8800)
| Profile | Std | Weight | Total steel | σ util | δ util | |
|---|---|---|---|---|---|---|
| W310x21 | AISC | 21 kg/m | 126 kg | 83% | 98% | |
| VS 300x23 | BR | 22.6 kg/m | 136 kg | 71% | 84% | |
| U 300x90x6.3 | BR | 23.1 kg/m | 139 kg | 82% | 98% | |
| U 300x100x6.3 | BR | 24.1 kg/m | 145 kg | 77% | 91% | |
| VS 250x25 | BR | 24.6 kg/m | 148 kg | 70% | 100% |
Elastic bending (σ = M/Sx vs fy/γa1, γa1 = 1.10 — NBR 8800) + deflection screening of the full flexural catalog. Lateral-torsional buckling, shear and local buckling are NOT checked here — run the full NBR 8800 / AISC 360 verification in the 3D editor.
Five ways the factor gets misused
- Multiplying a static ductile steel design stress by Kt. Double counting. The code already checks the net section, and the peak has redistributed.
- Mixing the reference areas. Using the gross area for σnom while reading a net referenced Kt, or the reverse. The two differ by (1 − d/w), and mixing them corrupts the peak.
- Ignoring Kt in fatigue because steel is ductile. Fatigue is precisely the case where it does not redistribute.
- Confusing Kt with Kf. Kt is theoretical, elastic, geometric. Kf is the fatigue value, smaller, and material dependent through notch sensitivity. Always Kf ≤ Kt.
- Reading the chart wrong. Using the bolt diameter instead of the hole diameter, or a hole chart for a fillet, lands on a factor that belongs to a different part.
So which number do you use?
For a static, ductile steel member: use the gross section and net section checks with Fy and Fu, and no stress concentration factor. For fatigue, brittle, or cold service: the peak governs, and you move to Kf and the detail categories.
The textbook number is not wrong. It answers a different question. Kt tells you how high the elastic stress spikes, not how much load the member carries. Knowing which of those two questions you are actually asking is the whole skill.
Sources
- 1.Hibbeler, Resistência dos Materiais (Mechanics of Materials), stress concentrations under axial load
- 2.Pilkey, Peterson's Stress Concentration Factors, circular hole in a finite width strip
- 3.Young and Budynas, Roark's Formulas for Stress and Strain, Chapter 17
- 4.AISC 360 Specification for Structural Steel Buildings, Chapter D (Tension Members)
- 5.ABNT NBR 8800 Design of steel and composite structures, tension members
Try CalcSteel for free
Model, analyze and design steel structures in your browser. No install, no signup.
Open the 3D editor