Sizing a Crane Runway Beam: the Fatigue Check That Decides the Section
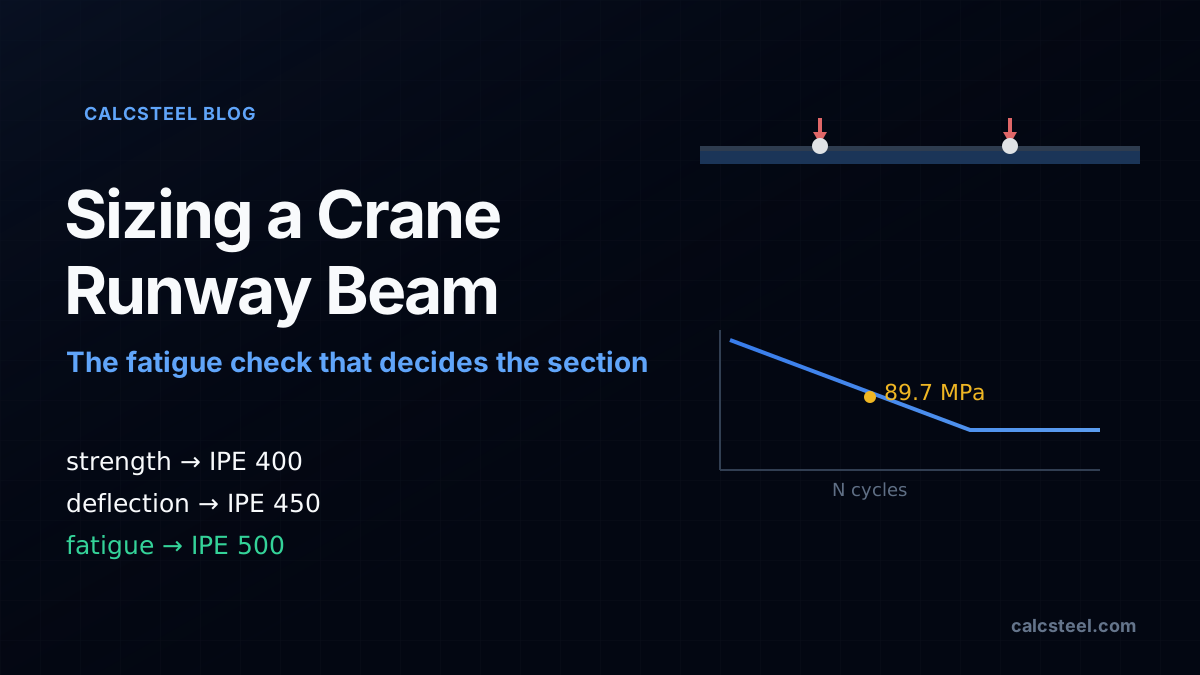
A crane runway beam is the one steel member you size for the load that is almost never on it. You check it for the peak wheel load, but what actually chooses the section is fatigue: the same crane rolling over the same bay a few million times. This guide sizes one 6 m runway bay three ways, strength, deflection and fatigue, on the real CalcSteel FEM engine, and shows the fatigue check push the section two sizes past the strength answer.
Key takeaways
- A crane runway beam carries moving wheel loads, not a fixed load, so the design moment comes from the crane position that maximises it. For our two wheels on a 6 m bay the engine returns 151.875 kN·m, matching the closed-form absolute-maximum-moment position to the digit.
- Sized for bending strength alone, an IPE 400 passes (utilisation 0.88). The vertical deflection limit L/600 = 10 mm then rules it out (12.5 mm) and pushes the section up to an IPE 450 (8.5 mm).
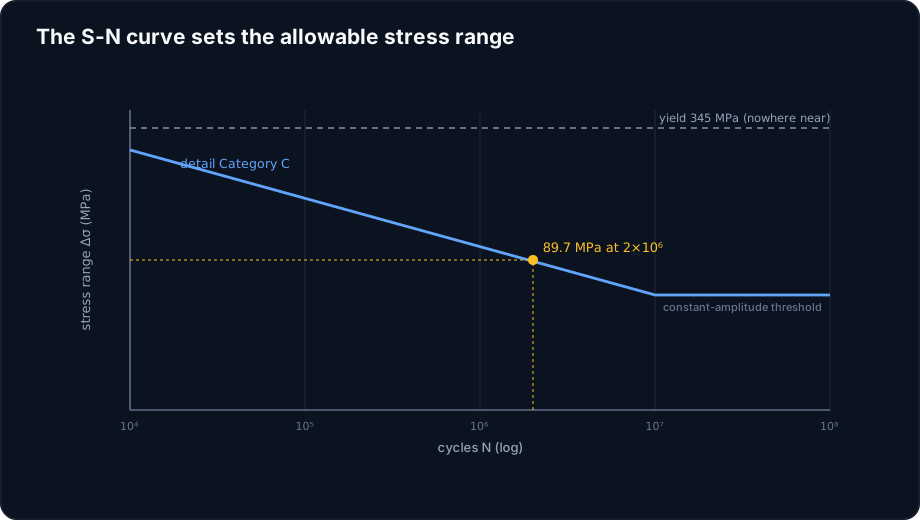
- Fatigue is checked on the stress range from one everyday crane passage, at service load and with NO impact factor, against a low allowable set by the welded detail, not by the yield strength. At an AISC Category C detail for 2 million cycles the allowable range is about 89.7 MPa (13.0 ksi).
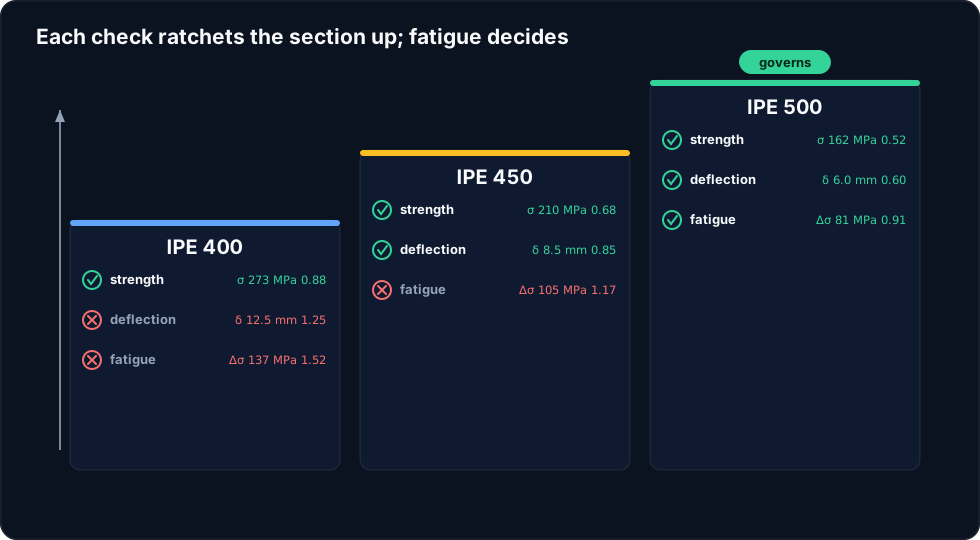
- That single check decides the beam: the stress range is 136.7 MPa on the IPE 400 and 104.9 MPa on the IPE 450, both failing, and only the IPE 500 (81.2 MPa, utilisation 0.91) passes. Fatigue lands one size above deflection and two above strength.
- The engine is trustworthy: its two-wheel deflections reproduce the closed-form 12.53, 8.55 and 5.96 mm to four decimals, so the section that fatigue selects rests on a verified stiffness.
The member you size for a load that is hardly ever there
Most steel members are sized for a load that sits still. A floor beam carries its design load and holds it; a column carries its axial load for the life of the building. A crane runway beam is different. The load it carries is a pair of wheels that roll along it, arrive at the worst spot for a few seconds, and leave, over and over, for decades. The peak wheel load matters, but it is on any given cross-section only a fraction of the time.
That changes what actually decides the section. If you size the runway beam the way you size a floor beam, for the bending strength under the peak wheel load, you will get a member that is perfectly safe against a single overload and still wrong, because the thing that governs a runway beam is usually not strength and often not even deflection. It is fatigue: the slow accumulation of damage from the same stress range repeating a few million times. This article takes one ordinary runway bay and sizes it three ways on the CalcSteel finite element engine, strength, deflection and fatigue, and watches the fatigue check quietly overrule the other two.
What a crane runway beam actually carries
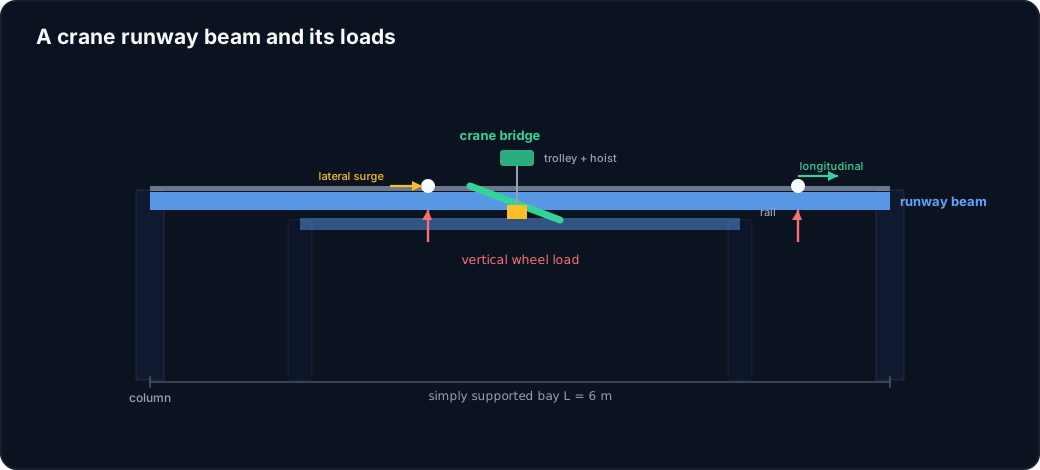
A crane runway beam is the horizontal girder that a travelling overhead crane rides on. The crane bridge spans between two runways, one down each side of the bay, and its end trucks put wheels on a rail sitting on top of each runway beam. As the crane travels and the trolley moves across the bridge, those wheel loads travel with it. Three families of load reach the runway beam, and they act at once:
- Vertical wheel loads. The largest action. Each wheel delivers a concentrated load, magnified by a vertical impact (or dynamic) factor because the crane is moving and the hoist snatches the load.
- Lateral surge. A horizontal force across the rail, from acceleration of the trolley and hoisted load, resisted mostly by the top flange (and any cap channel), which is why runway sections are often reinforced at the top.
- Longitudinal tractive force. A smaller horizontal force along the rail, from the crane braking and accelerating as it travels, taken out through the runway bracing.
The runway is usually built as a series of simply supported bays, one span between each pair of columns, so that differential column settlement does not throw moments into the girder. That is the structure we size here: a single simply supported bay, spanning 6 m, carrying the wheels of one bridge crane.
The worked bay: two wheels, one span
Here is the example we carry all the way through. A single bridge crane travels the runway; its end truck puts two wheels on this rail, spaced 3.0 m apart (the wheel base of the end truck). The maximum static load under each wheel, from the crane self-weight plus the hoisted load at its worst trolley position, is Pmax = 90 kN. The bay spans L = 6.0 m, simply supported.
Two adjustments turn those static wheels into design actions. For strength, the vertical load is magnified by an impact factor: AISC and ASCE 7 add 25% for a cab or radio operated bridge crane, so the design wheel load becomes 1.25 × 90 = 112.5 kN, and the crane load is then factored as a live load (1.6 in LRFD). For fatigue, neither of those applies: the check runs on the service wheel load, 90 kN, with no impact factor and no load factor, because fatigue is driven by the stress range of the everyday event, not by a rare peak. Hold on to that asymmetry, it is the whole reason the checks disagree.
One more feature of a moving load: the worst crane position is not the same for every effect. The position that maximises the bending moment is not the position that maximises the deflection. We have to find each one.
The moving-load moment: find the worst position
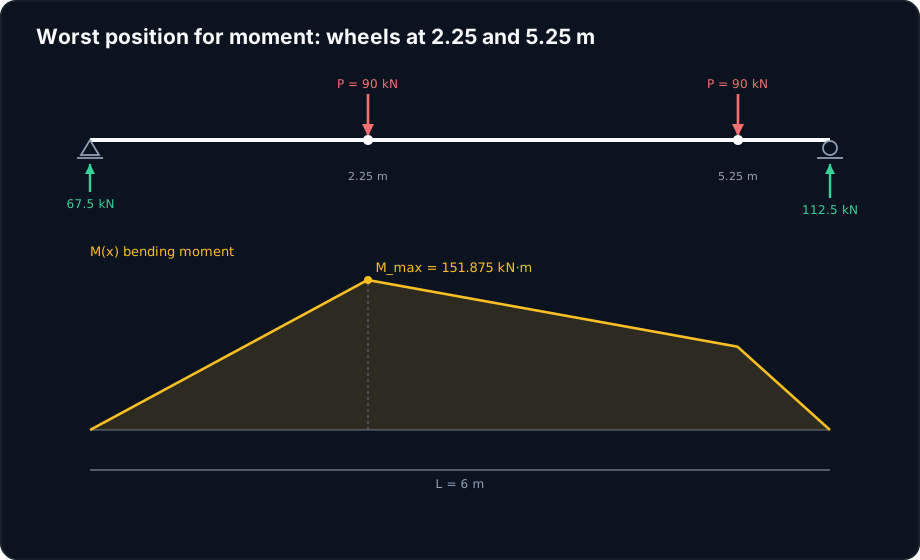
With a fixed load you read the maximum moment off a formula. With two rolling wheels you first have to place them. The absolute maximum moment under a set of moving loads occurs when the beam centreline bisects the distance between the resultant of the loads and the wheel nearest to it. For our two equal 90 kN wheels 3.0 m apart, that puts the wheels at 2.25 m and 5.25 m from the left support.
Take the reactions from statics: the resultant 2P = 180 kN sits at 3.75 m from the left, so the left reaction is 180 × (6 − 3.75) / 6 = 67.5 kN and the right is 112.5 kN. The moment under the wheel at 2.25 m is 67.5 × 2.25 = 151.875 kN·m, and that is the peak. Dropping the same model into the CalcSteel engine, which meshes the bay and solves it as a frame, returns a maximum moment of 151.875 kN·m, matching the hand calculation exactly. That agreement is the anchor for everything that follows: the demand is not an estimate.
This is the service, no-impact moment, and it is the number the fatigue check will use directly. For strength we scale it up: with impact and the live-load factor, the design moment is 1.6 × 1.25 × 151.875 = 303.75 kN·m.
Check 1: bending strength picks the smallest section
Now size the beam for bending. Using an elastic bending-stress check, which is standard practice for crane runways because they are kept elastic under the service crane, the demand is σ = Mu / Sx and the resistance is φ·Fy with φ = 0.9. For steel with Fy = 345 MPa that resistance is 310.5 MPa, and the factored design moment is 303.75 kN·m.
Try the lightest candidate, an IPE 400. The engine computes its elastic section modulus as Sx = 1111 cm³, so the bending stress is 303.75 kN·m / 1111 cm³ = 273.4 MPa, a utilisation of 0.88. It passes. If bending strength were the whole story, we would specify the IPE 400 and move on. It is not, and we will not.
This is the trap the title warns about. The strength check is real and the IPE 400 genuinely will not yield or buckle under the factored crane, but a runway beam is asked two more questions before it is allowed to be a runway beam.
Check 2: deflection rules out the strength answer
A crane runway that sags too much under its crane is unusable long before it is unsafe: the rail dips, the crane labours over the hollow, and the wheels wear the rail and each other. So codes cap the vertical deflection of the runway beam under the service wheel loads, commonly at L/600 for a moderate-duty crane (AISE and CMAA give L/600 to L/1000 depending on class). For our 6 m bay that limit is 10.0 mm.
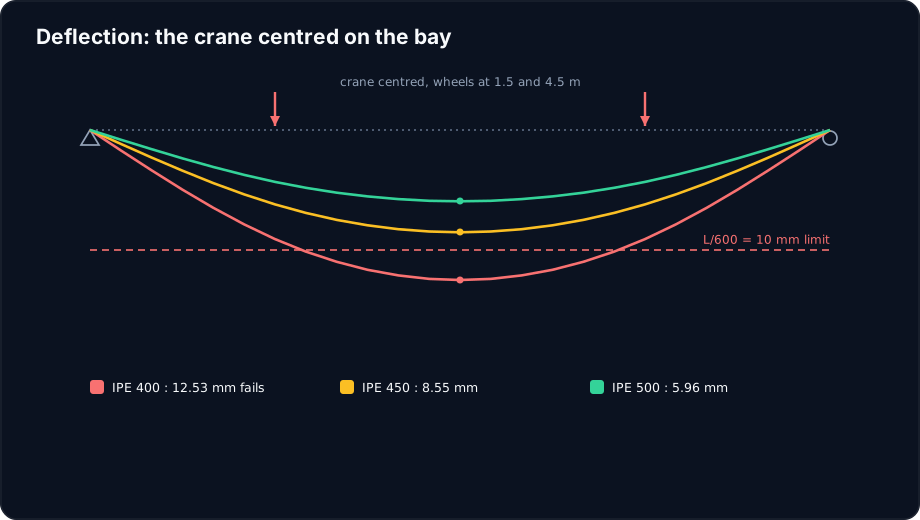
Deflection is checked at the crane position that maximises it, which is the crane centred on the bay, wheels symmetric about midspan at 1.5 m and 4.5 m, not the offset position that maximised the moment. This is where the moving load earns its reputation for being fiddly: two different worst positions for two different effects.
Run the three candidates centred, at the service 90 kN wheel loads with no impact:
| Section | Ix (engine) | Deflection, crane centred | vs L/600 = 10 mm |
|---|---|---|---|
| IPE 400 | 22,222 cm⁴ | 12.53 mm | Fails (1.25) |
| IPE 450 | 32,578 cm⁴ | 8.55 mm | Passes (0.85) |
| IPE 500 | 46,747 cm⁴ | 5.96 mm | Passes (0.60) |
The IPE 400 that passed strength fails deflection at 12.53 mm, and the section steps up to an IPE 450. Worth noting how trustworthy those millimetres are: the engine's two-wheel deflections reproduce the closed-form δ = P·a·(3L² − 4a²)/(24EI) to four decimals (12.5296, 8.5467, 5.9563 mm), so this is not a soft serviceability guess, it is the same double integral you would do by hand, meshed.
Try it: roll two wheel loads across a span
Before the fatigue check, build the intuition with the beam yourself. The calculator below is the CalcSteel beam tool. Set a 6 m simply supported span and place two point loads of 90 kN; slide them to 2.25 m and 5.25 m to read the peak moment near 152 kN·m, then move them to 1.5 m and 4.5 m to read the larger deflection. Change the section and watch the moment stay put while the deflection and the bending stress move.
That last observation is the seed of the whole article: the moment demand does not care which section you pick, but the stress does, because stress is moment divided by section modulus. Fatigue is a stress-range check, so it is the section modulus, not the span or the load, that you buy your way out of trouble with.
Max moment
45 kN·m
Max shear
30 kN
Max deflection
10.55 mm
= L/569
Bending stress σ
84.4 MPa
σ = M/Sx
Utilization
44.0%
NBR 8800 · δ ≤ L/250
Geometry & supports
Section
Ix 7999 cm⁴ · Sx 533 cm³ · 42.2 kg/m
Point loads (↓ positive)
None — add as many as you need.
Distributed loads (uniform or trapezoidal)
Model sketch
Diagrams — free PNG / SVG / CSV export, no watermark
Step-by-step — the calculation memory of YOUR beam
IPE 300 · L = 6 m · fy = 250 MPa
1. Reactions (equilibrium of the solved FEM model)
ΣFy = 0 · ΣM = 0
R_A = 30 kN · R_B = 30 kN
2. Peak shear (read from the SFD)
Vmax = |V(x)|max
Vmax = -30 kN @ x = 6 m
3. Peak moment (read from the BMD)
Mmax = |M(x)|max
Mmax = 45 kN·m @ x = 3 m
4. Peak deflection
EI = 15998 kN·m² (E = 200 GPa)
δmax = 10.55 mm @ x = 3 m = L/569
5. Elastic bending stress
σ = Mmax / Sx = 45.00 × 10³ / 533.3
σ = 84.4 MPa
6. Bending check — both codes, side by side
NBR 8800: σ ≤ fy/1.10 = 227.3 MPa · AISC 360: σ ≤ 0.90·fy = 225 MPa
NBR 37.1% PASS · AISC 37.5% PASS
7. Deflection check (serviceability — code-independent)
δ ≤ L/250 = 24 mm
10.55 mm / 24 mm = 44.0% PASS
Recomputed live from the current inputs by the direct-stiffness FEM engine — change any load and every step updates. Reproduce it by hand with the formulas in the sections below.
Lightest catalog profiles that pass (974 flexural candidates · NBR 8800)
| Profile | Std | Weight | Total steel | σ util | δ util | |
|---|---|---|---|---|---|---|
| W310x21 | AISC | 21 kg/m | 126 kg | 83% | 98% | |
| VS 300x23 | BR | 22.6 kg/m | 136 kg | 71% | 84% | |
| U 300x90x6.3 | BR | 23.1 kg/m | 139 kg | 82% | 98% | |
| U 300x100x6.3 | BR | 24.1 kg/m | 145 kg | 77% | 91% | |
| VS 250x25 | BR | 24.6 kg/m | 148 kg | 70% | 100% |
Elastic bending (σ = M/Sx vs fy/γa1, γa1 = 1.10 — NBR 8800) + deflection screening of the full flexural catalog. Lateral-torsional buckling, shear and local buckling are NOT checked here — run the full NBR 8800 / AISC 360 verification in the 3D editor.
Check 3: fatigue, the stress range of the everyday crane
Strength and deflection both looked at the crane once, at its worst. Fatigue looks at the crane every day. A point on the tension flange of the runway beam sees its stress rise from near zero, when the crane is parked on another bay, up to a maximum as the wheels roll overhead, then fall back to near zero as they leave. That rise and fall is a stress range, Δσ, and it repeats once per crane pass, a few million times over the structure's life. Metal fails under enough repetitions of a stress range far below its yield strength; that is fatigue.
The check has three ingredients:
- The applied stress range Δσ = M_service / Sx, from the service moment (151.875 kN·m) with no impact and no load factor.
- The number of cycles N, from how hard the crane works. A moderately used crane runs on the order of 2 million cycles over its life (an AISC loading condition / CMAA class in that range).
- The detail category, which fixes the allowable stress range for that N from the S-N (Wöhler) curve. It is a property of the welded or bolted detail at the checked point, not of the steel grade.
For a common welded runway detail, an AISC 360 Category C condition (for example a transverse stiffener or attachment weld in the high-stress zone), the allowable stress range at 2 million cycles is FSR = (Cf/N)^(1/3) = (44×10⁸ / 2×10⁶)^(1/3) = 13.0 ksi, which is about 89.7 MPa. Eurocode reaches the same neighbourhood: EN 1993-1-9 detail category 90 has a reference range of 90 MPa at 2 million cycles. Note how low that number is: 89.7 MPa is barely a quarter of the 345 MPa yield strength. The material is nowhere near yielding, and it still governs.
The section fatigue actually chooses
Now put the three checks on the same three sections. The stress range is Δσ = 151.875 kN·m / Sx, and it must stay under 89.7 MPa. Every stress and deflection below is the engine's value.
| Section | Sx | Strength σ (≤ 310.5) | Deflection (≤ 10 mm) | Fatigue Δσ (≤ 89.7) | Verdict |
|---|---|---|---|---|---|
| IPE 400 | 1111 cm³ | 273.4 MPa (0.88) | 12.53 mm (1.25) | 136.7 MPa (1.52) | Fails deflection and fatigue |
| IPE 450 | 1448 cm³ | 209.8 MPa (0.68) | 8.55 mm (0.85) | 104.9 MPa (1.17) | Fails fatigue |
| IPE 500 | 1870 cm³ | 162.4 MPa (0.52) | 5.96 mm (0.60) | 81.2 MPa (0.91) | Passes all three |
Read the last column down. Strength was satisfied by the IPE 400. Deflection pushed it to the IPE 450. Fatigue rejects even the IPE 450, at a stress range of 104.9 MPa against an 89.7 MPa allowable, and is only satisfied by the IPE 500. The fatigue check lands one full size above the deflection answer and two above the strength answer. On a beam sized for strength, the fatigue utilisation would have been 1.52, a 52% overstress you would never see in a strength calculation, because the strength calculation is asking a different question.
That is the sentence in the title made concrete. For this runway bay, the fatigue check decides the section. Strength and deflection are necessary, but neither is binding; the crane that passes two million times is.
Why the fatigue allowable is so far below yield
The surprising part is not that fatigue matters, it is how little stress it takes. Why is the allowable range only 89.7 MPa when the steel yields at 345? Because fatigue cracks start at stress concentrations, and a structural steel member is full of them: the toe of a fillet weld, the end of a cover plate, a bolt hole, the sharp corner of a coped end, the weld attaching a stiffener. At those spots the local stress is several times the nominal value the calculation tracks, and each load cycle nudges a microscopic crack forward. The detail category is really a ranking of how severe that local concentration is.
Two levers follow directly, and a runway designer uses both:
- Lower the stress range, by using a bigger section modulus. That is what took us to the IPE 500. It is reliable but it costs steel.
- Improve the detail, by moving up a category: grind a weld toe smooth, stop a cover plate short of the high-stress zone, replace a fillet-welded attachment with a bolted one, avoid welding anything to the tension flange. A better detail raises the allowable range and can save the section.
The flip side is the warning: a worse detail is expensive. An AISC Category E detail (say an unstiffened cover-plate end or a poorly placed attachment) has an allowable range of only about 56 MPa at 2 million cycles, well below Category C. Against that lower allowable, even the IPE 500's 81.2 MPa range fails, and you would be chasing a still heavier section or forced to improve the detail. On a crane runway, the drawing of the weld matters as much as the size of the beam.
What the codes ask, and where the cycles come from
The three ingredients above are exactly what each code formalises; the packaging differs.
- AISC 360, Appendix 3 gives the S-N curves as FSR = (Cf/N)^(1/3) ≥ FTH, with Cf and the threshold FTH tabulated by detail category (A through E'). AISC Design Guide 7 (industrial buildings) is the practical companion for crane runways, and it, with ASCE 7, sets the vertical impact (25% for cab or radio operated bridge cranes) and reminds you that impact is not applied in the fatigue evaluation.
- Eurocode splits the work: EN 1993-6 covers crane supporting structures and the load model, and points fatigue at EN 1993-1-9, whose detail categories (160, 90, 71, 56 …) are the reference stress range at 2 million cycles. The everyday spectrum is condensed into one damage-equivalent range with a factor λ that depends on the crane's fatigue class, so a single check on λ·Δσ against the category does the job.
- The cycle count is the input you cannot skip. It comes from the crane's service classification, CMAA 70 classes A to F, or the AISC loading conditions 1 to 4, which translate the expected number of lifts and their weight spectrum into a design N. A light, rarely used crane (few cycles) may never be fatigue-governed; a busy process crane (many millions of cycles) almost always is.
The common thread: fatigue is checked at service load, on a stress range, against an allowable fixed by the detail and the cycle count. Every one of those is different from the strength check, which is why the two so often disagree about the section.
Common mistakes and FAQ
"Size it for the peak wheel load and you are done." That is the strength check, and for a runway beam it is usually the least demanding of the three. Our peak-load section, the IPE 400, was overstressed by 52% in fatigue.
"Apply the impact factor everywhere." No. Impact magnifies the load for strength and for the deflection you compare to the code limit, but the fatigue stress range is computed without impact, on the service wheel load. Adding impact to the fatigue range is a real and common error that makes the beam look worse than it is.
"Fatigue is only for bridges and heavy process cranes." It is cycle-driven, so a lightly used maintenance crane with a low cycle count may genuinely be strength-governed. But a normal production crane reaches a few million cycles quickly, and then fatigue governs. You decide by counting cycles, not by intuition.
"A stronger steel fixes fatigue." It does not. The detail categories are almost independent of yield strength: the allowable range at a Category C weld is about 89.7 MPa whether the plate is 250 or 450 MPa steel. Higher-grade steel buys strength, not fatigue life. Section modulus and detail quality buy fatigue life.
"The bottom flange is the fatigue problem." The bottom flange carries the largest tensile range, but the failure usually starts at a detail: a stiffener weld, a bracket, the connection to the column, or the top-of-web region under the wheel. Plain rolled base metal is a high category; it is what you weld to it that drops the number.
From a rolling wheel to the deciding check
A crane runway beam is sized by a load that is hardly ever on any one cross-section, and the check that decides it is not the obvious one. Strength asks whether the beam survives the worst single pass; deflection asks whether it stays usable; fatigue asks whether it survives the same ordinary pass repeated a few million times, and for a normal production crane fatigue asks the hardest question. On our 6 m bay it moved the section from an IPE 400 to an IPE 500, two sizes, purely on a stress range of 104.9 MPa against an 89.7 MPa allowable.
CalcSteel runs the moving-load envelope to find the worst crane position, returns the moment and the deflection the wheels produce, on the same FEM engine whose two-wheel deflections matched closed-form theory to four decimals, and checks the member against AISC 360, Eurocode 3 and NBR 8800. Model your own runway bay in the editor, roll the wheels across it, and let the fatigue check tell you the section before the crane does. If your bay is continuous rather than simply supported, the moving-load ideas here connect straight to our guide on shear force and bending moment diagrams.
Sources
- 1.ANSI/AISC 360, Specification for Structural Steel Buildings (Appendix 3, Design for Fatigue)
- 2.AISC Design Guide 7, Industrial Building Design (crane loads, runway beams, fatigue)
- 3.EN 1993-6, Eurocode 3: Design of steel structures, Part 6: Crane supporting structures
- 4.EN 1993-1-9, Eurocode 3, Part 1-9: Fatigue (detail categories, S-N curves)
- 5.CMAA Specification 70, Multiple Girder Electric Overhead Traveling Cranes (service classes, deflection)
Try CalcSteel for free
Model, analyze and design steel structures in your browser. No install, no signup.
Open the 3D editor