Shear Force & Bending Moment Diagrams: Guide
Learn how to draw shear force and bending moment diagrams step by step. Covers sign conventions, equilibrium checks, and real beam examples with formulas.
What are shear force and bending moment diagrams?
A shear force diagram (SFD) plots the internal shear V along the length of a beam, while a bending moment diagram (BMD) plots the internal moment M. Together they reveal where a beam is most stressed and where it will fail first.
Every structural analysis course starts with these two diagrams because they connect external loads to internal resistance. Without an SFD and BMD you cannot size a beam — the maximum moment selects the section, and the maximum shear checks the web.
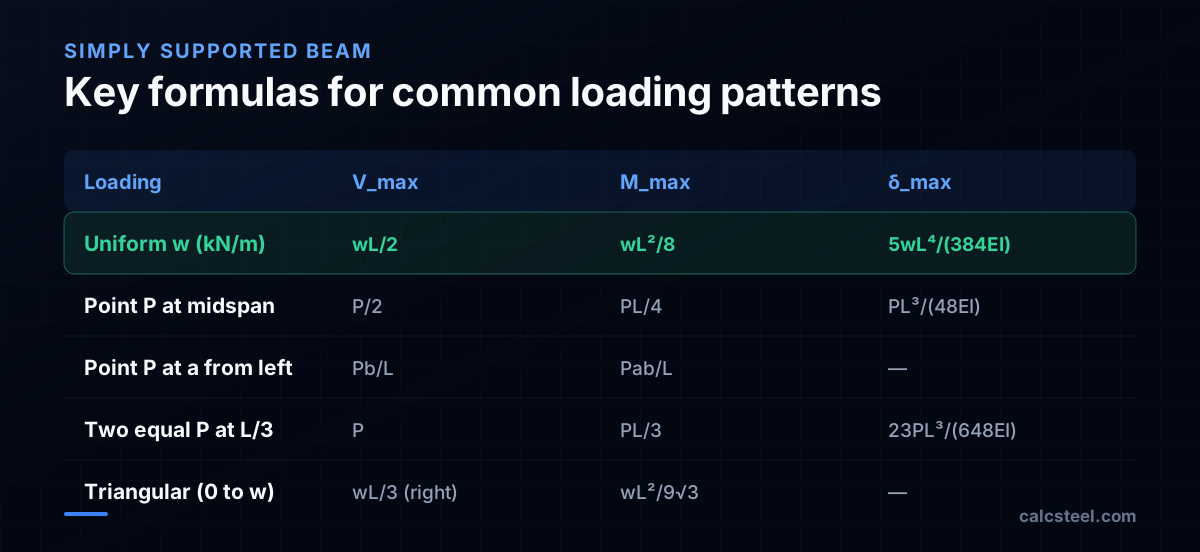
The fundamental relationship tying them together is differential equilibrium: the slope of the moment diagram at any point equals the shear at that point (dM/dx = V), and the slope of the shear diagram equals the negative of the distributed load (dV/dx = −w). These two equations let you draw both diagrams from loads alone.
How do you draw a shear force diagram step by step?
Follow this procedure for any statically determinate beam:
- Find support reactions — Write equilibrium equations (ΣFy = 0, ΣM = 0) and solve for all vertical reactions.
- Start at the left end — The shear value jumps up by the left reaction.
- Move right through each load — For a distributed load w, the shear drops linearly at rate w per unit length. For a point load P, the shear jumps instantaneously by −P (downward) or +P (upward).
- Check at the right support — The shear should jump back to zero at the right reaction. If it does not, there is an equilibrium error.
Worked example — uniform load
Consider a simply supported beam of span L = 8 m carrying a uniform load w = 10 kN/m.
- Total load: W = wL = 80 kN
- Reactions: R_A = R_B = 40 kN (by symmetry)
- At x = 0: V = +40 kN (upward reaction)
- The shear decreases linearly: V(x) = 40 − 10x
- At midspan (x = 4 m): V = 0 kN — this is where the maximum moment occurs
- At x = 8 m: V = 40 − 80 = −40 kN, then the right reaction brings it back to zero
The completed SFD is a straight line from +40 kN to −40 kN, crossing zero at midspan.
How do you draw a bending moment diagram from the shear diagram?
Since dM/dx = V, the moment diagram is the integral of the shear diagram:
- Start at zero — For a simply supported beam, the moment at a pin or roller is zero.
- Integrate the shear — Where the shear is positive and constant, the moment increases linearly. Where the shear decreases linearly (uniform load), the moment curve is parabolic.
- Maximum moment occurs where V = 0 — This is the critical section for flexural design.
- End at zero — The moment at the other simple support must return to zero.
Continuing the example
For our 8 m beam with w = 10 kN/m:
- M(x) = 40x − 10x²/2 = 40x − 5x²
- At midspan (x = 4 m): M_max = 40(4) − 5(16) = 160 − 80 = 80 kN·m
- Quick check: wL²/8 = 10(8)²/8 = 80 kN·m ✓
The BMD is a symmetric parabola peaking at 80 kN·m at midspan. This value directly enters the beam design equation: the required section modulus is S_req = M_max / (φF_y) for LRFD, or M_max / (F_y/Ω) for ASD.
> CalcSteel tip: The 3D analysis engine automatically computes internal forces and renders SFD/BMD for every member — but understanding the hand method is essential for checking your model.
What is the sign convention for shear force and bending moment?
Sign conventions vary between textbooks, but the most widely used in structural engineering is:
- Positive shear (+V): The resultant of forces to the left of the section acts upward (or equivalently, forces to the right act downward). This creates a clockwise rotation tendency on the element.
- Positive moment (+M): The beam bends concave up — "sagging" or "smiling." The bottom fiber is in tension.
- Negative moment (−M): The beam bends concave down — "hogging" or "frowning." The top fiber is in tension.
Consistency matters more than which convention you pick. AISC and most US practice uses the convention above. Some European texts reverse the shear sign. Whatever you choose, keep it through the entire problem.
A practical consequence: for a simply supported beam under gravity loads, the bottom flange is in tension at midspan. For a cantilever, the top flange is in tension at the fixed support. This determines which flange needs lateral bracing.
What are the shear and moment formulas for common beam loading cases?
Engineers memorize a handful of cases because they appear constantly in practice:
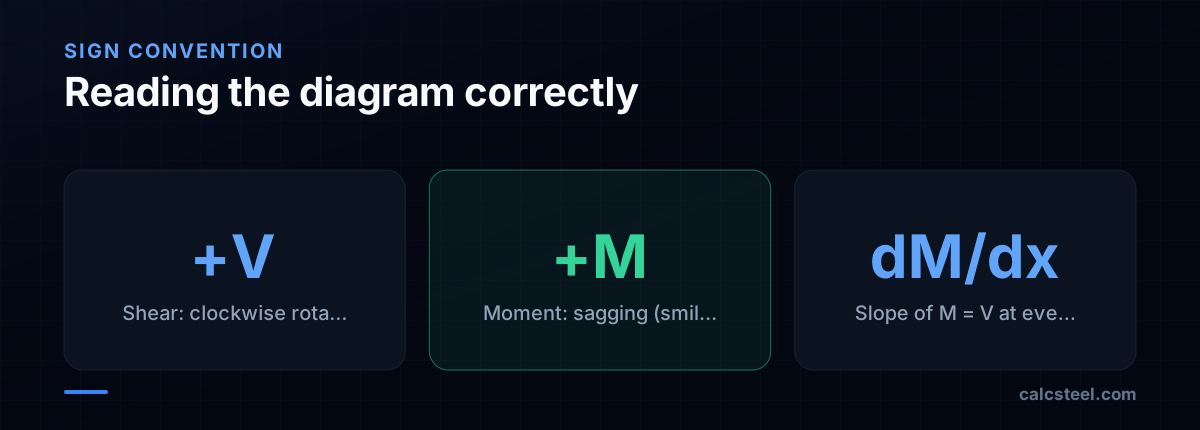
Simply supported beam — uniform load w - V_max = wL/2 (at supports) - M_max = wL²/8 (at midspan) - δ_max = 5wL⁴/(384EI) (at midspan)
Simply supported beam — concentrated load P at midspan - V_max = P/2 (constant between support and load) - M_max = PL/4 (at midspan) - δ_max = PL³/(48EI)
Cantilever — uniform load w - V_max = wL (at fixed end) - M_max = wL²/2 (at fixed end) - δ_max = wL⁴/(8EI) (at free end)
Cantilever — point load P at free end - V_max = P (constant along span) - M_max = PL (at fixed end) - δ_max = PL³/(3EI)
Fixed-fixed beam — uniform load w - V_max = wL/2 (at supports) - M_max = wL²/12 (at supports, negative) - M_midspan = wL²/24 (at midspan, positive)
Notice that fixing both ends cuts the midspan moment by a factor of 3 compared to simple supports (wL²/24 vs wL²/8). This is why moment connections are worth the fabrication cost on longer spans.
How does load distribution affect maximum bending moment?
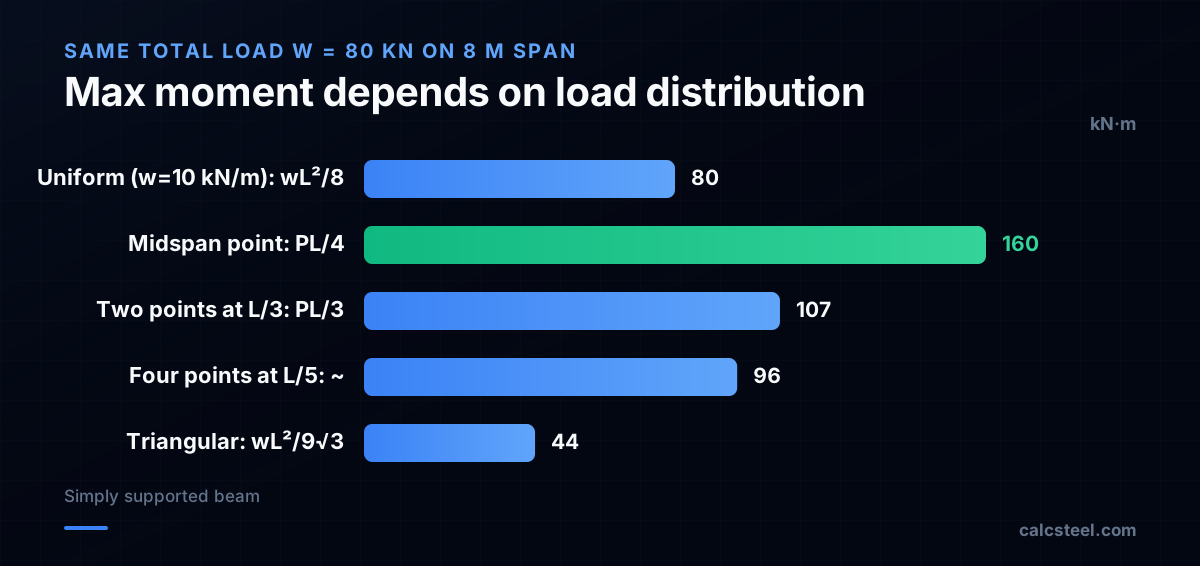
For the same total load W on the same span L, the way the load is distributed dramatically changes the peak moment:
| Distribution | M_max | Ratio to uniform |
|---|---|---|
| Uniform (wL²/8) | WL/8 | 1.00 |
| Single point at midspan (PL/4) | WL/4 | 2.00 |
| Two points at L/3 (PL/3) | WL/3 per point, net WL/6 from each half | 1.33 |
| Triangular (peak at one end) | WL/(9√3) | 0.55 |
The midspan point load gives the largest moment — exactly double the uniform case — because the entire load is concentrated at the worst possible location. Conversely, a triangular distribution (like a soil pressure diagram) produces the smallest moment because most of the load is near a support.
Practical implication
When modeling floor beams carrying joists, replacing a series of point loads with an equivalent uniform load is conservative if the joists are closely spaced (spacing ≤ L/4). For fewer, widely spaced loads, use actual point load analysis or you will undersize the beam.
Superposition
For combined loading, you can superpose diagrams: draw each load case separately, then add the ordinates. This works because the equilibrium equations are linear for small deformations. CalcSteel's analysis engine uses the direct stiffness method, which handles any combination automatically.
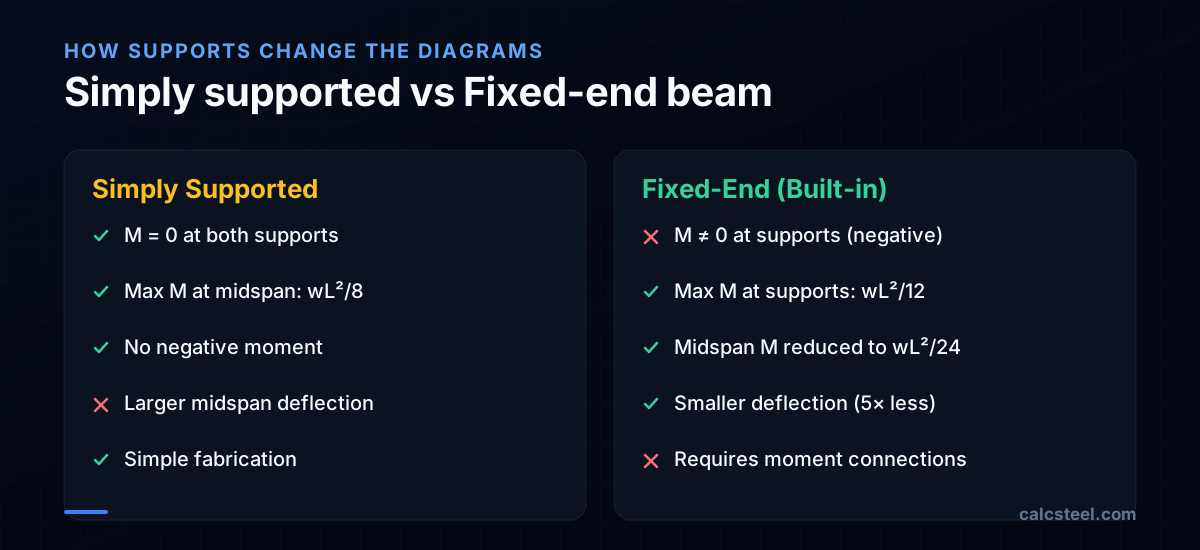
How do support conditions change the shear and moment diagrams?
The type of support fundamentally reshapes both diagrams:
Simply supported (pin + roller) - Moment is zero at both ends - All moment is positive (sagging) under gravity loads - Maximum moment occurs away from the supports - Reactions are purely vertical (no horizontal restraint at roller)
Fixed (built-in) at one end — cantilever - Moment is maximum at the fixed end (negative / hogging) - Moment decreases to zero at the free end - The shear at the fixed end equals the total applied load - The fixed end must resist both shear and moment — needs moment connection
Fixed at both ends - Negative moments develop at both supports - The midspan positive moment is much smaller than the simply supported case - The beam is stiffer (less deflection) but statically indeterminate - Points of inflection (M = 0) appear between supports and midspan
Continuous beams (multiple spans) - Negative moments appear over interior supports - Adjacent span loads affect each other - Moving loads create moment envelopes — the BMD depends on which spans are loaded - Must analyze pattern loading: alternate spans loaded and adjacent spans loaded
For continuous beams, hand methods become tedious. The three-moment equation or moment distribution method were used historically; today, a matrix stiffness solver handles any number of spans instantly.
How do you check a shear and moment diagram for errors?
Before using diagram results for design, verify these consistency checks:
- Equilibrium closure — The shear at the right end, after adding the right reaction, must return to exactly zero. Any residual means an arithmetic error in the reactions.
- Area-under-shear equals moment change — The change in moment between any two points equals the area under the shear diagram between those points: ΔM = ∫V dx. This is the most powerful check.
- Moment at simple supports is zero — If your diagram shows moment at a pin or roller, something is wrong (unless there is an applied external moment at that point).
- Shear jumps equal point loads — At every concentrated load P, the shear diagram must jump by exactly P. At every concentrated moment M₀, the moment diagram jumps by M₀ but the shear diagram is unaffected.
- Slope consistency — Where w = 0, the shear is constant (flat). Where w is constant, the shear is linear. Where V = 0, the moment has zero slope (local maximum or minimum).
- Symmetry — For symmetric beams with symmetric loading, both diagrams must be symmetric (SFD is antisymmetric, BMD is symmetric about midspan).
Real-world verification
In professional practice, compare your hand diagrams against software output. CalcSteel displays shear and moment diagrams for every load combination — use the hand calculation to verify the model, then use the model for the full set of load combinations that would be impractical by hand.
Try CalcSteel for free
Model, analyze and design steel structures in your browser. No install, no signup.
Open the 3D editor