Fatigue Detail Categories: the Same Weld, Two Categories, and a Different Life
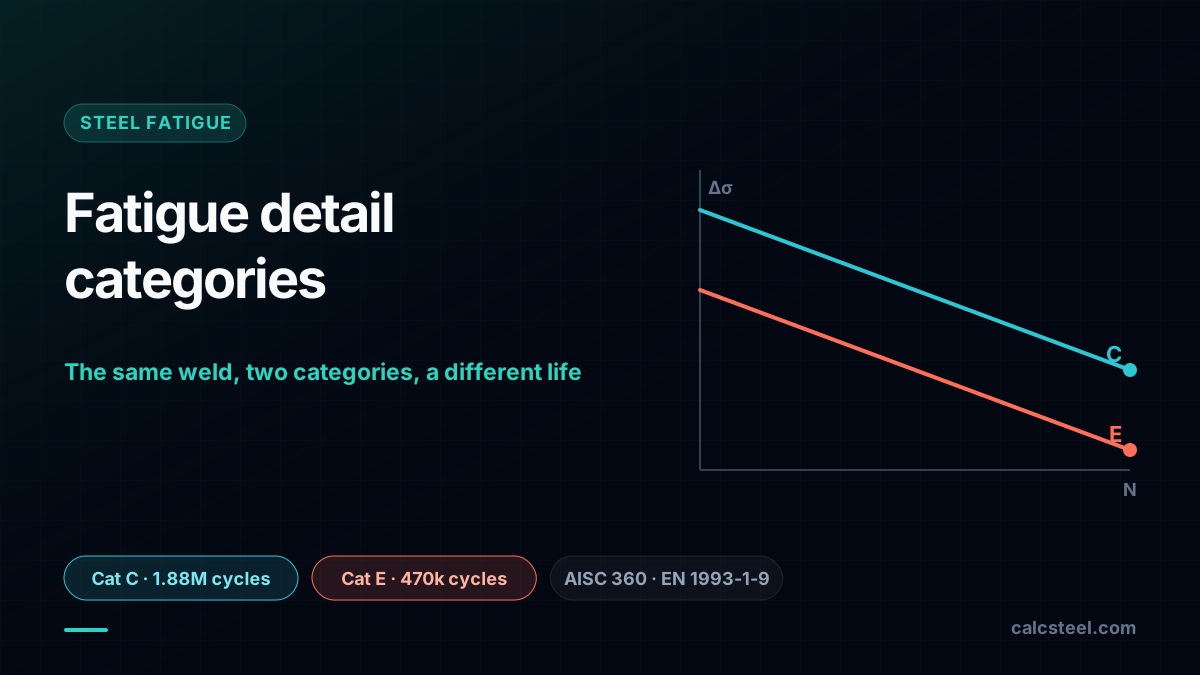
Fatigue detail categories decide if the same weld lasts forever or cracks early. See one real beam, seven lives, and size yours with the free calculator.
Key takeaways
- The category is the design: a fatigue detail category ranks a joint's local stress concentration, sets its S-N curve, and fixes the allowable range and life, independent of the steel grade.
- One nominal stress, many lives: our IPE 360 over 8.0 m with a repeated 40 kN load gives Mmax = 80.0 kN·m and Sx = 873.77 cm3, so Δσ = 91.6 MPa, the single number every category is checked against.
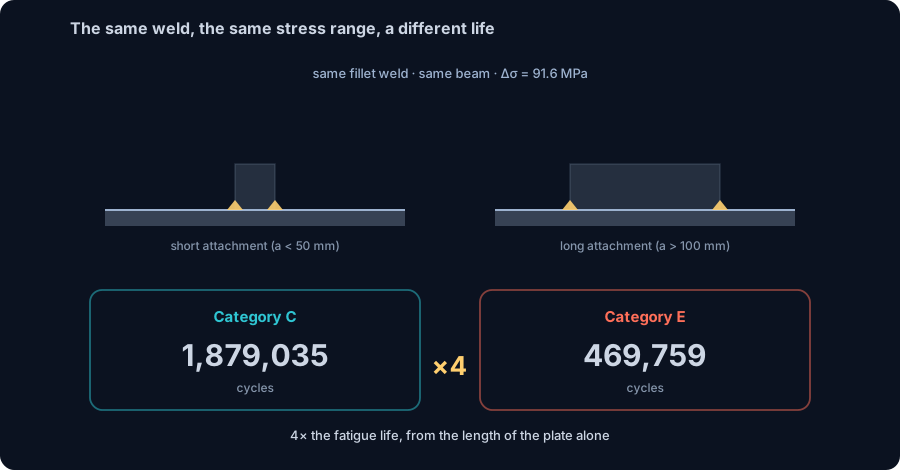
- The same weld, four times the life: a 40 mm attachment is Category C and lasts 1,879,000 cycles; a 150 mm attachment is Category E and lasts 469,759 cycles, a ratio of exactly 4.0 from the plate length alone.
- The threshold makes it absolute: drop the range to 60 MPa and Category C sits below its 69 MPa threshold for infinite life, while Category E still cracks at 1,669,000 cycles.
- You control the category: stress direction, attachment length, grinding the weld toe or reinforcement flush, inspection level, and keeping welds off the tension flange all move a detail up or down the A to E' ladder.
Fatigue detail categories: the same weld, two categories, and a different life
Two welds on the same shop drawing can look identical: same throat, same electrode, same beam under them. Yet one gives the beam infinite fatigue life, and the other cracks in a few hundred thousand cycles. The steel is fine. The section is fine. What decides the outcome is the fatigue detail category: a letter or a number that ranks how sharp the local stress concentration at the joint really is.
This is the piece of steel design that surprises people the most, because it does not obey the intuition you built on strength checks. On a strength check you make the member bigger or the steel stronger and the problem goes away. On a fatigue check, a higher steel grade buys you almost nothing, and the geometry of the little plate you welded to the flange can cut the life by a factor of four, or flip it from forever to finite.
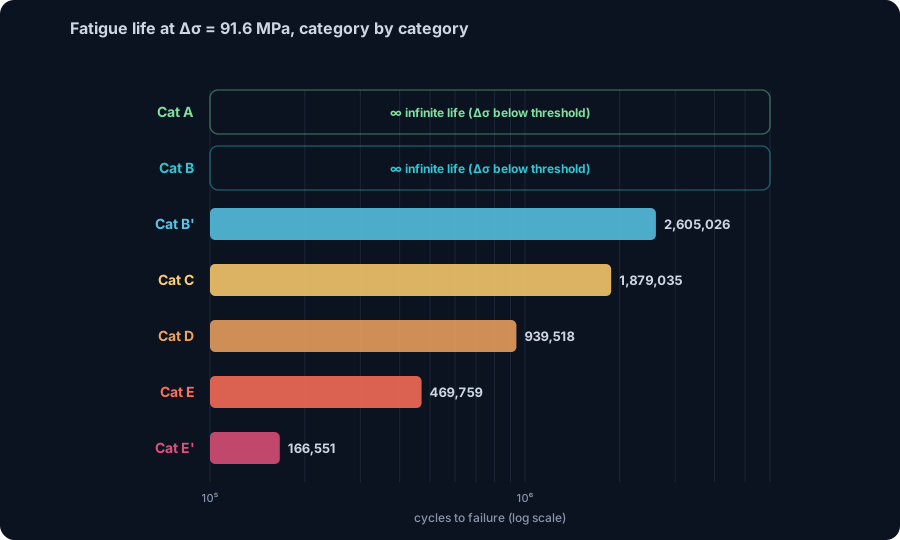
This is a base level guide written for three readers: the engineering student meeting fatigue for the first time, the working calculista who sizes members every week, and the independent engineer who has to defend a detail to a client. We define every term before we use it, and we anchor the whole discussion to one real beam. We ran a simply supported IPE 360 on the CalcSteel finite element engine, took a single nominal stress range from it, and then walked the fatigue life of the same welded detail from infinite all the way down to 167,000 cycles, changing nothing but the category. One beam, one stress, seven very different lives.
What a fatigue detail category actually is
A fatigue detail category is a letter (AISC uses A, B, B', C, D, E, E') or a number (Eurocode uses the reference stress in MPa) that ranks how severe the local stress concentration of a welded or bolted joint is. It fixes the S-N curve for that joint, and therefore fixes the allowable stress range and the fatigue life at a given number of cycles.
Read that definition twice, because the trap is in what the category is not. The category is a property of the detail, that is, the geometry of the connection and how it was made and inspected. It is not a property of the steel grade: a joint made in 250 MPa steel and the same joint made in 690 MPa steel sit on the same fatigue curve. And it is not the nominal stress: the nominal stress is what you compute from the member and the load, while the category is the multiplier that tells you how damaging that stress is at this particular joint.
Why a ranking at all? Because a fatigue crack does not start from the average stress in the cross section. It starts at a tiny geometric discontinuity, almost always the toe of a weld, where the stress locally spikes far above the nominal value. Every welded joint has such a spike, but some are much sharper than others. Rather than ask each engineer to compute that local peak, the codes did the work once, tested hundreds of representative details to failure, and sorted them into categories. The category already carries the concentration. That is why, as we will see, you check fatigue against the nominal stress and not against the local peak.
So a smooth rolled beam with no attachments is a very high category. Weld a plate to its flange and you have introduced a new, sharper discontinuity, and the category drops. The rest of this guide is about exactly how far it drops, and why the same weld can land in two different categories.
The S-N curve: where a category becomes a number
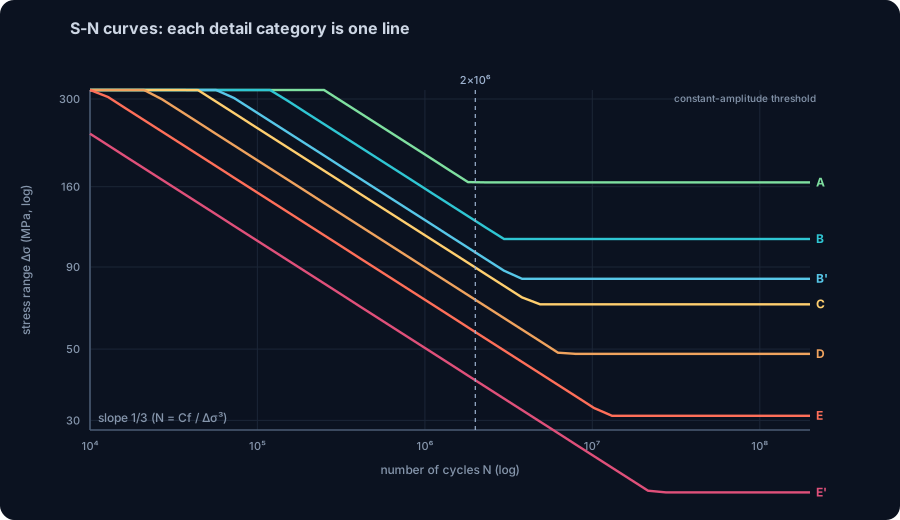
The category is a name. To turn it into an allowable stress range you use the S-N curve, also called the Wohler curve after the engineer who first plotted it in the 1860s. On this plot the vertical axis is the stress range applied to the detail, and the horizontal axis is the number of cycles the detail survives before it cracks, both on logarithmic scales. Test a detail at a high stress range and it fails after few cycles; test it low and it lasts long. Join those points and you get a straight, descending line.
Each category is one of those lines. AISC 360-16, Appendix 3, writes the line as a simple law:
FSR = (Cf / N)1/3
Here FSR is the allowable stress range, N is the number of cycles, and Cf is a constant that names the category. A better category means a larger Cf, which lifts the whole line higher, so at the same number of cycles it permits a larger stress range. Turn the equation around and you get the life directly:
N = Cf / Δσ3
Read that cube carefully, because it is where the drama lives. Life scales with the cube of the stress range. Halve the range and the life goes up eightfold. And since the categories differ only by their Cf, the ratio of two lives at the same stress is simply the ratio of the two Cf values. That single fact produces the headline of this article later on.
One more feature closes the curve at the right end. Every category has a horizontal floor called the constant-amplitude fatigue threshold, written FTH. If the applied stress range stays below that threshold, the descending line stops descending: the detail has effectively infinite life and no fatigue check is required. This is why the same detail can be finite at one stress and immortal at a slightly lower one. The threshold is a real line on the plot, and crossing it is a step change, not a gradual one.
A note on the constant Cf: AISC Table A-3.1 literally prints small numbers such as 4.4 or 1.1, because the printed equation carries a factor of 1000. Restated cleanly, those are Cf values of 44×108 and 11×108. The two forms are algebraically identical; throughout this guide we use the ×108 form so the arithmetic checks by hand.
A real beam, one nominal stress range
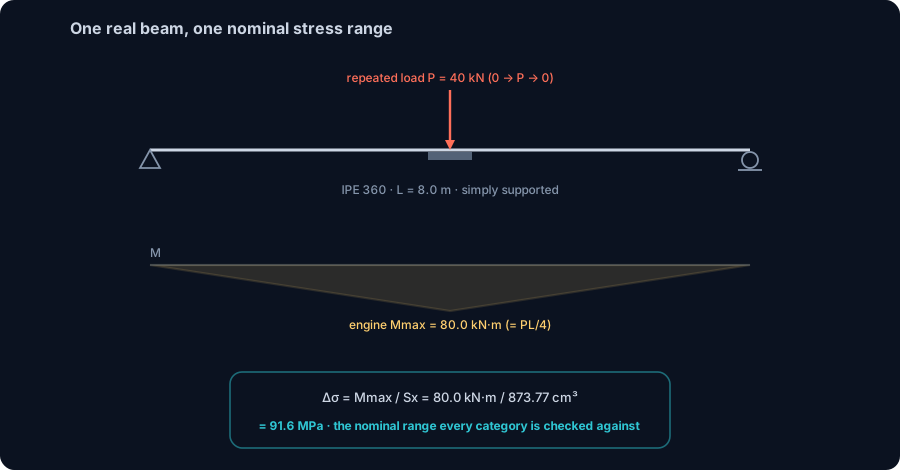
To keep the whole article honest, we anchor every category to one real result from the CalcSteel finite element engine. The model is deliberately plain: a simply supported beam, span L = 8.0 m, rolled section IPE 360. At midspan sits a repeated service live load, think of an overhead hoist or a piece of equipment whose reaction lands on this beam. Each operating cycle the load rises from about zero up to P = 40 kN and falls back to zero.
The engine returns a maximum moment of Mmax = 80.0 kN·m, and a left reaction of 20.0 kN, which is exactly P/2. Both match the closed form to the digit: for a central point load, PL/4 = 40 × 8 / 4 = 80.0 kN·m. When the machine reproduces the hand value exactly, you know the model is clean and the number you carry forward is trustworthy.
Next we need the section property that turns moment into stress. The engine reports the elastic section modulus of the IPE 360 as Sx = 873.77 cm³. The bending stress at the extreme flange fibre is M divided by that modulus.
Now the key move. Fatigue does not care about the peak stress, it cares about the stress range, meaning the swing from the lowest to the highest stress in a cycle. Because our load cycles from 0 up to P and back to 0, the stress at the flange swings from 0 up to the full bending stress and back. So the nominal stress range is the full bending stress:
Δσ = Mmax / Sx = 80.0 kN·m / 873.77 cm³ = 91.6 MPa
Hold on to that number. It is a nominal stress: the ordinary bending stress you would compute in any first course, with no stress concentration factor applied to it, because the detail category will carry the concentration for us. And it is the same 91.6 MPa for every category we are about to test. We are not changing the beam, the load, or the stress. We change only which detail is welded to the flange, and we watch the life move.
The same weld, two categories
Here is the part that surprises people the first time they meet it. Take one fillet weld attaching a plate, a gusset, or a stiffener to the tension flange of our beam. The weld metal is the same, the throat is the same, the beam is the same, and the nominal stress range is the same 91.6 MPa we computed. Yet the fatigue category, and therefore the fatigue life, is not fixed until you know one more thing: how long the attached plate is.
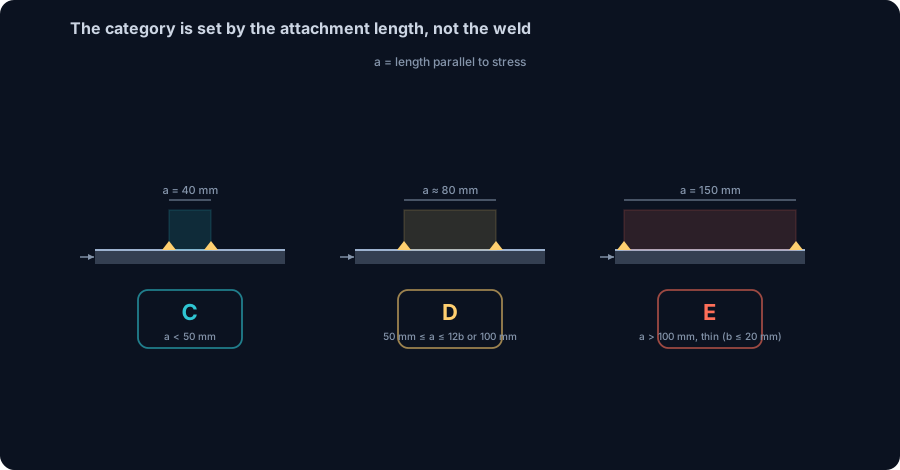
In AISC 360-16 Table A-3.1, a welded attachment loaded in the direction of the applied stress is classified by two lengths. The first is a, the length of the attachment measured parallel to the stress direction (how far the plate runs along the flange). The second is b, the thickness of that attachment. The longer the plate runs alongside the flange, the more abruptly the stress has to flow around its welded end, and the lower the category drops.
The exact breakpoints:
- a < 50 mm (2 in): Category C.
- 50 mm ≤ a ≤ the lesser of 12b or 100 mm (4 in): Category D.
- a longer than the lesser of (12b, 100 mm), with a thin attachment b ≤ 20 mm (0.8 in): Category E.
- a > 100 mm (4 in), with a thick attachment b > 20 mm (0.8 in): Category E', the harshest of the welded-attachment cases.
So picture two beams on the shop floor. On the first, someone welds a 40 mm long clip to the tension flange: a = 40 mm is under 50 mm, so it is Category C. On the second, someone welds a 150 mm long plate in exactly the same position, with the same fillet weld: a = 150 mm is past the limit, so it is Category E. Identical weld metal, identical throat, identical beam, identical 91.6 MPa nominal stress. The only thing that changed is the length of the plate you welded on. That single geometric choice, made without a second thought at the drafting table, is about to become a factor of four in fatigue life.
And a different life
Now plug the one nominal stress range, Δσ = 91.6 MPa, into the S-N law N = Cf / Δσ3 for each of those two categories.
- Category C (Cf = 44×108): life N = 1,879,000 cycles.
- Category E (Cf = 11×108): life N = 469,759 cycles.
That is a ratio of exactly 4.0. It is not a coincidence and it is not an approximation: because both details see the same stress range, the cube term cancels, and the life ratio is just the ratio of the two category constants, 44 / 11 = 4.0. The short 40 mm plate buys you nearly 1.9 million cycles; the long 150 mm plate spends most of that back and leaves you under half a million. The same weld, four times the life. If the hoist runs a few hundred cycles a day, that is the difference between a detail that outlives the building and one that is cracking within a handful of years.
The threshold flip: a sharper regime. The factor of four is dramatic, but there is a second effect that is even more absolute, and it appears the moment your stress range drops near a category threshold. Suppose we lighten the load a little, or step up to a slightly deeper section, so the nominal range falls to Δσ = 60 MPa.
For Category C, the constant-amplitude threshold is FTH = 69 MPa. Our 60 MPa is now below that threshold, so the Category C detail has infinite life: no fatigue crack, no finite count, done. For Category E, the threshold is only 31 MPa, and 60 MPa is still well above it, so the Category E detail is firmly in the finite regime: N = Cf / Δσ3 = 1,669,000 cycles.
Read that again. Same weld, same beam, same 60 MPa stress range. One detail lasts forever. The other cracks at 1.67 million cycles. There is no smooth trade here, no percentage penalty you can absorb: crossing a threshold turns an infinite-life joint into a finite-life one. That is the "different life" of the title made absolute, and it is why the classification decision matters as much as the stress calculation that feeds it.
Try it: get your own nominal stress range
The whole story above hangs on one number you can compute for your own beam: the nominal stress range Δσ. Everything after that is table lookup. So before you leave this page, build your case and read the moment straight off the engine.
The live beam calculator below mounts right here. Use it to set your span, place the repeated load where it actually sits (midspan, a wheel position, an equipment reaction), and read the maximum moment the beam sees. For our worked example that moment was Mmax = 80.0 kN·m on an 8.0 m span with 40 kN at midspan, which the CalcSteel FEM engine matched to the closed form PL/4 to the digit.
From there the nominal stress range is one division. Take the moment, divide by the elastic section modulus of your section, and (because the load cycles from about zero up to the peak and back) that bending stress is your stress range:
Δσ = Mmax / Sx. For the IPE 360, with Sx = 873.77 cm³, that gave 80.0 kN·m / 873.77 cm³ = 91.6 MPa. Carry your own Δσ into the category table in the next section, pick the row that matches your detail, and you have the fatigue life.
It is genuinely free, and there is no login for the math: open the beam calculator, or drop straight into the full 3D editor when you want the real section, the real supports, and the FEM engine behind them. Students can unlock everything free through the education offer.
Max moment
45 kN·m
Max shear
30 kN
Max deflection
10.55 mm
= L/569
Bending stress σ
84.4 MPa
σ = M/Sx
Utilization
44.0%
NBR 8800 · δ ≤ L/250
Geometry & supports
Section
Ix 7999 cm⁴ · Sx 533 cm³ · 42.2 kg/m
Point loads (↓ positive)
None — add as many as you need.
Distributed loads (uniform or trapezoidal)
Model sketch
Diagrams — free PNG / SVG / CSV export, no watermark
Step-by-step — the calculation memory of YOUR beam
IPE 300 · L = 6 m · fy = 250 MPa
1. Reactions (equilibrium of the solved FEM model)
ΣFy = 0 · ΣM = 0
R_A = 30 kN · R_B = 30 kN
2. Peak shear (read from the SFD)
Vmax = |V(x)|max
Vmax = -30 kN @ x = 6 m
3. Peak moment (read from the BMD)
Mmax = |M(x)|max
Mmax = 45 kN·m @ x = 3 m
4. Peak deflection
EI = 15998 kN·m² (E = 200 GPa)
δmax = 10.55 mm @ x = 3 m = L/569
5. Elastic bending stress
σ = Mmax / Sx = 45.00 × 10³ / 533.3
σ = 84.4 MPa
6. Bending check — both codes, side by side
NBR 8800: σ ≤ fy/1.10 = 227.3 MPa · AISC 360: σ ≤ 0.90·fy = 225 MPa
NBR 37.1% PASS · AISC 37.5% PASS
7. Deflection check (serviceability — code-independent)
δ ≤ L/250 = 24 mm
10.55 mm / 24 mm = 44.0% PASS
Recomputed live from the current inputs by the direct-stiffness FEM engine — change any load and every step updates. Reproduce it by hand with the formulas in the sections below.
Lightest catalog profiles that pass (974 flexural candidates · NBR 8800)
| Profile | Std | Weight | Total steel | σ util | δ util | |
|---|---|---|---|---|---|---|
| W310x21 | AISC | 21 kg/m | 126 kg | 83% | 98% | |
| VS 300x23 | BR | 22.6 kg/m | 136 kg | 71% | 84% | |
| U 300x90x6.3 | BR | 23.1 kg/m | 139 kg | 82% | 98% | |
| U 300x100x6.3 | BR | 24.1 kg/m | 145 kg | 77% | 91% | |
| VS 250x25 | BR | 24.6 kg/m | 148 kg | 70% | 100% |
Elastic bending (σ = M/Sx vs fy/γa1, γa1 = 1.10 — NBR 8800) + deflection screening of the full flexural catalog. Lateral-torsional buckling, shear and local buckling are NOT checked here — run the full NBR 8800 / AISC 360 verification in the 3D editor.
The whole ladder, A to E' (and the Eurocode map)
Here is every AISC fatigue detail category on one ladder, checked against the single nominal stress range from our worked beam, Δσ = 91.6 MPa. Read it top to bottom and you are watching the fatigue life fall from infinite to 167,000 cycles, without the steel, the section or the stress ever changing. Only the detail changes.
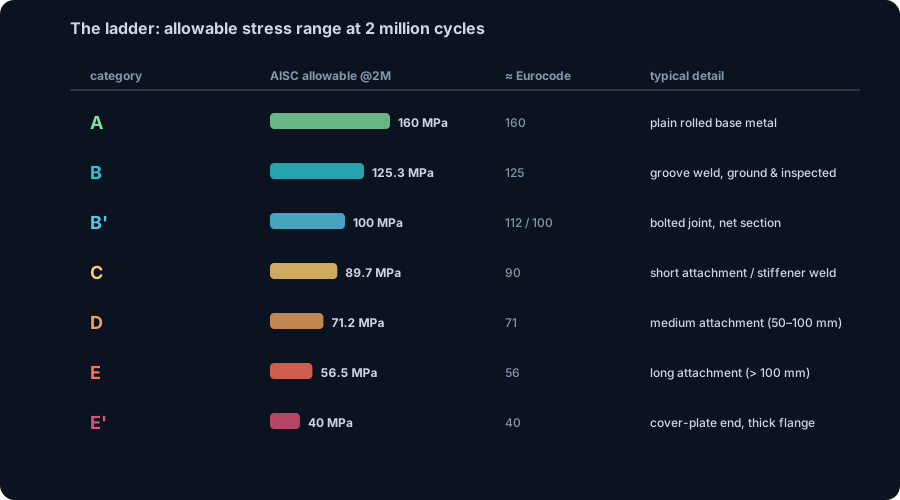
The allowable column is the stress range each category permits at the reference life of 2 million cycles, straight from AISC 360-16 Appendix 3, Table A-3.1. The life column is what our detail actually gets at 91.6 MPa, from N = Cf / Δσ3. Where 91.6 MPa sits below the category threshold FTH, the life is infinite and no fatigue check is needed.
| Category | Cf | Allowable range at 2M | EN 1993-1-9 Δσc | An everyday detail | Life at Δσ = 91.6 MPa |
|---|---|---|---|---|---|
| A | 250 × 108 | 160 MPa (23.2 ksi) | 160 | Plain rolled base metal, away from any weld or hole | Infinite (below FTH = 165 MPa) |
| B | 120 × 108 | 125 MPa (18.2 ksi) | 125 | Continuous longitudinal weld; a CJP groove weld ground flush and inspected | Infinite (below FTH = 110 MPa) |
| B' | 61 × 108 | 100 MPa (14.5 ksi) | 100 | Built-up members with certain longitudinal welds | 2,605,000 cycles |
| C | 44 × 108 | 89.7 MPa (13.0 ksi) | 90 | Transverse CJP groove weld left as-welded; a short attachment, less than 50 mm long, parallel to the stress; a transverse stiffener | 1,879,000 cycles |
| D | 22 × 108 | 71.2 MPa (10.3 ksi) | 71 | An attachment between 50 mm and the lesser of 12b or 100 mm long, welded to the flange | 940,000 cycles |
| E | 11 × 108 | 56.5 MPa (8.2 ksi) | 56 | A long attachment, over 100 mm, on a thin flange; the end of a cover plate on a thin flange | 470,000 cycles |
| E' | 3.9 × 10⁸ | 40 MPa (5.8 ksi) | 40 | The end of a cover plate on a thick flange (tf over 20 mm) | 167,000 cycles |
Two things are worth pausing on. First, the Cf values are printed in Table A-3.1 as 250, 120, 61, 44, 22, 11 and 3.9 once you restate them as the × 108 form. The code equation carries a factor of 1000, so the table literally prints 25, 12, 6.1, 4.4, 2.2, 1.1 and 0.39, which are algebraically the same numbers. Either way the ratio between categories is what drives the life.
Second, look at the two right-of-centre columns together. The AISC allowable stress ranges at 2 million cycles line up almost one-to-one with the Eurocode EN 1993-1-9 detail categories, which are named directly by the reference range Δσc at 2M in MPa: 125 is category B, 100 is B', 90 is C, 71 is D, 56 is E and 40 is E'. The letters and the numbers are two labels for the same S-N ladder, and Brazil's ABNT NBR 8800 uses the same framework aligned with AISC. Learn one and you can read all three.
To turn any of these into a life for your own beam, you only need your own nominal stress range. Build the span in the free beam calculator, read the moment, divide by the section modulus, and drop the result into this table.
What moves a detail up or down
The category is not handed to you by fate. It is set by decisions the designer and the fabricator make, and most of them are free or nearly free. Here are the levers that move a detail up or down the ladder:
- The direction of stress relative to the weld axis. A weld loaded along its length is far kinder than the same weld with the stress crossing it. Details are classified by how the fluctuating stress runs through the joint, not by the weld size.
- How the weld terminates, and whether it wraps. A weld that stops abruptly at a sharp end leaves the worst possible stress raiser exactly where the crack wants to start. Wrapping the weld around the end, or returning it, softens that termination.
- Grinding the weld toe or reinforcement smooth. The crack starts at the toe. Grinding the toe or the reinforcement flush, in line with the stress, removes the sharp geometry and lifts the category, sometimes a full step.
- Removing backing bars. A backing bar left in place creates a built-in crevice at the root, an ideal crack starter. Removing it and, where required, back-gouging and rewelding the root raises the detail.
- The length of the attachment. As the crux of this article showed, a 40 mm attachment is Category C and a 150 mm attachment on the same flange is Category E. Longer parallel attachments concentrate stress harder, so keep welded attachments short where you can.
- Keeping welds off the tension flange. The tension flange carries the largest stress range in bending, so any attachment welded there is checked at the highest Δσ. Move discretionary attachments to the web or a low-stress zone and the same detail category buys far more life.
- The inspection level. Some high categories are only available if the weld is proven by radiographic or ultrasonic testing. Without that inspection, the code will not let you claim the better line.
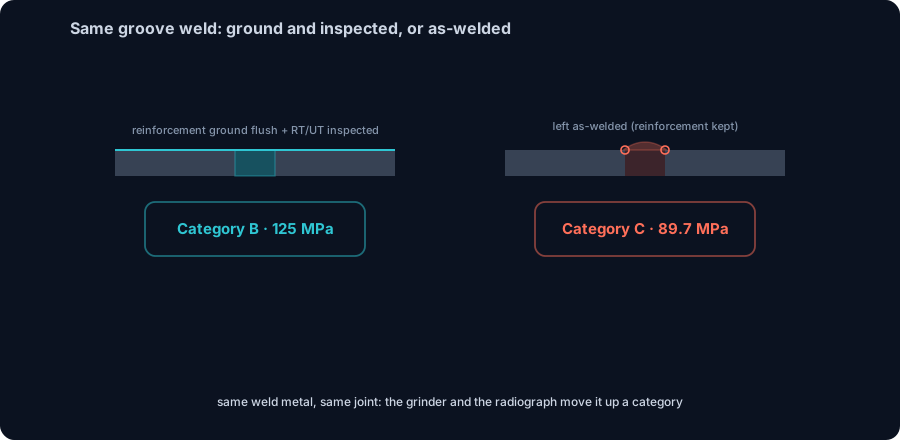
The clearest illustration is a transverse complete-joint-penetration (CJP) groove weld, a full-thickness butt weld with the stress crossing it. If its reinforcement is ground essentially parallel to the stress and the weld is inspected by RT or UT, it is Category B, allowable 125 MPa at 2 million cycles. Leave the very same joint as-welded, reinforcement not removed, and it drops to Category C, 89.7 MPa. Identical weld metal, identical joint geometry: the grinder and the radiograph move it one category. At our nominal range of 91.6 MPa that one category is the difference between infinite life as a Category B detail and 1,879,000 cycles as a Category C detail. A finishing operation, not a redesign, buys unlimited life.
Why the allowable is a quarter of yield
The Category C allowable at 2 million cycles is 89.7 MPa (13.0 ksi). For an ordinary steel with a yield around 345 MPa, that is roughly a quarter of yield. It looks alarmingly low until you see what the number is protecting against. Static strength asks whether the whole cross-section can carry the load once. Fatigue asks something narrower and meaner: whether a microscopic crack will start at a stress raiser and grow, cycle by cycle, until it runs. Those cracks begin at the stress concentration at the weld toe, where the local peak stress is several times the nominal value even though the member as a whole is nowhere near yield.
The detail category is, in effect, a ranking of how severe that local concentration is. Because the category already carries the concentration, the fatigue check is run on the nominal stress range, the plain M over S bending stress, not on the local peak. That is why the allowable has to be so far below yield: it is doing the work of the stress concentration factor for you, so you never compute the peak stress yourself. Feed it the nominal range and the category has already accounted for the geometry.
Two facts from the AISC Commentary follow from this, and both surprise people the first time:
- Fatigue strength is essentially independent of steel grade. Across yield strengths from about 250 to 690 MPa, a given detail has the same fatigue life. Higher-grade steel buys you more static strength, not more fatigue life. If fatigue governs, specifying a stronger steel changes nothing, you have to change the detail.
- Only the stress range matters, not the mean, minimum or maximum stress. A cycle from 10 to 100 MPa and a cycle from minus 40 to plus 50 MPa do the same damage, because they share the same range of 90 MPa. The reason is residual stress: welded details lock in near-yield tensile residual stress, so no matter where the applied cycle nominally sits, the metal at the weld toe is already pulled up near yield and the entire applied range is damaging. This is exactly why our load that swings from 0 to 40 kN and back gives a full stress range of 91.6 MPa, and why that range, not any peak or average, is the number the whole ladder is checked against.
So the low allowable is not conservatism for its own sake. It is the honest price of welding to a member that will be cycled millions of times, and the way to pay less of it is to choose a better detail, not a stronger steel.
What the codes say
Three code families describe the same physics with slightly different bookkeeping. If you can read one, you can read the others, because they all rest on the same S-N law and the same idea of a detail category.
AISC 360-16, Appendix 3, Table A-3.1. This is the reference used throughout this post. Each detail is assigned a category from A down to E', and each category carries a constant Cf and a constant-amplitude fatigue threshold FTH. The allowable stress range is FSR = (Cf / N)^(1/3), never taken below FTH. Below the threshold the life is treated as infinite and no fatigue check is required. Because the code equation carries a factor of 1000, the table literally prints the Cf values as 25, 12, 6.1, 4.4, 2.2, 1.1 and 0.39; restated as the plain constants they are 250, 120, 61, 44, 22, 11 and 3.9 times 10^8, which is what we used to compute every life in this post. At two million cycles those categories allow 160, 125, 100, 89.7, 71.2, 56.5 and 40 MPa (23.2, 18.2, 14.5, 13.0, 10.3, 8.2 and 5.8 ksi).
One caution about root cracks. Table A-3.1 also lists a pair of cases, C' and C'', that describe cracking from the weld root rather than the toe. They share the Category C constant, Cf = 44 times 10^8, but their threshold is listed as "None". A detail with no threshold cannot be given infinite life at any stress range, so a joint that can fail from the root must always be checked as finite life. Keep these out of your main ladder, but remember they exist when the load path runs through the weld throat.
Eurocode EN 1993-1-9. The European standard names its detail categories by the reference stress range at two million cycles, in MPa: 160, 140, 125, 112, 100, 90, 80, 71, 63, 56, 50, 45, 40, 36 and so on. Its S-N curve is a slope of m = 3 down to the constant-amplitude limit at five million cycles, then a shallower slope of m = 5, then a cut-off at 10^8 cycles. The numbers map almost one to one onto AISC: 125 lines up with B, 100 with B', 90 with C, 71 with D, 56 with E and 40 with E'. Same ladder, different labels.
ABNT NBR 8800 (Brazil). The Brazilian steel standard carries the same detail-category and S-N framework, aligned with AISC. If you have worked the AISC table, the NBR table will feel familiar down to the letter.
The practical takeaway: pick one code for a given project and stay in it, but do not be surprised when a Eurocode "Category 90" and an AISC "Category C" give you the same life. They are two spellings of the same detail.
Common mistakes and FAQ
Most fatigue errors are not arithmetic errors. They are classification errors, made before any number is plugged in. Here is the short checklist we run before trusting a fatigue result.
- Do not reach for a higher steel grade to fix fatigue. The AISC Commentary is explicit that the fatigue strength of a given detail is essentially independent of yield strength from 250 to 690 MPa. Higher-grade steel buys static strength, not fatigue life. The crack does not know what grade it is growing through.
- Use the nominal stress range, not the local peak. The detail category already carries the stress concentration at the weld toe. If you feed it a finite-element hotspot stress on top of that, you count the concentration twice and the answer is meaningless. Check the same nominal 91.6 MPa we computed from M over Sx against every category.
- Only the range matters, not the mean. Because welded details lock in near-yield tensile residual stress, the whole applied range is damaging regardless of where it sits. Do not spend effort chasing a favorable minimum or mean stress; compute the range from the load that cycles, 0 to P to 0 in our beam, and stop.
- The base metal is a high category; what you weld to it is the problem. A clean rolled beam is Category A or B. Welding a plate, gusset or stiffener to its tension flange is what drops it to C, D, E or E'. The demotion travels with the attachment, not the beam.
- Classify by the illustrated detail, not the word "fillet". "It is a fillet weld" is not a category. The same fillet weld is Category C at a 40 mm attachment and Category E at a 150 mm attachment. Match your joint to the drawing in Table A-3.1, including the length a parallel to the stress and the thickness b.
- Impact and dynamic factors are for strength, not for the fatigue range. Amplification factors that inflate a load for an ultimate-strength check do not belong in the fatigue stress range. Fatigue uses the service load range that actually cycles.
Does a higher steel grade give my welded connection a longer fatigue life?
No. For a welded detail the fatigue life is set by the category, and the category is essentially independent of grade across the common range of structural steels. Switching from a 345 MPa yield to a 460 MPa yield does not move the S-N curve. If you need more life, change the detail, not the grade: shorten the attachment, grind the toe, or move the weld off the tension flange.
Should I use the peak stress from my FEM model in the fatigue check?
No, not with the nominal-stress method in AISC Appendix 3. The category was calibrated against nominal stress precisely so you would not have to model the weld toe. Read the nominal bending stress range, in our beam 91.6 MPa from 80.0 kN·m divided by Sx = 873.77 cm³, and check that against the category allowable. A separate hotspot or fracture-mechanics method exists, but it uses its own curves, not these categories.
My load never reverses, it only goes from zero up and back. Do I still have a fatigue range?
Yes. The range is maximum minus minimum, and 0 to P to 0 gives you the full bending stress as the range. That is exactly why our beam has Δσ = 91.6 MPa and not something smaller: the stress swings across its entire value on every cycle. A non-reversing load is still a cycling load.
Two joints on my drawing look identical. Can they really have different lives?
Yes, and that is the whole point of this post. The same fillet weld on the same flange under the same 91.6 MPa lasts 1,879,000 cycles as a Category C detail and 469,759 cycles as a Category E detail, a factor of 4.0, decided only by how long the attached plate is. Drop the range to 60 MPa and the Category C detail lasts forever while the Category E detail still cracks at 1,669,000 cycles. Identical weld metal, identical throat, different life.
Key takeaways
Fatigue in steel is not decided by the grade or by how far you are below yield. It is decided by the detail, and the detail is a choice you make on the drawing.
- The category is the design. A fatigue detail category ranks the local stress concentration of a joint, sets its S-N curve through FSR = (Cf / N)^(1/3), and therefore fixes the allowable range and the life. It is a property of the detail, not of the steel and not of the nominal stress.
- One nominal stress, many lives. Our real beam on the CalcSteel engine, an IPE 360 over 8.0 m with a repeated 40 kN at midspan, gives Mmax = 80.0 kN·m = PL/4 and Sx = 873.77 cm³, so Δσ = 91.6 MPa. Every category is checked against that one number.
- The same weld, four times the life. A 40 mm attachment is Category C and lasts 1,879,000 cycles; a 150 mm attachment is Category E and lasts 469,759 cycles. Same weld, factor of 4.0, from the plate length alone.
- The threshold makes it absolute. Lower the range to 60 MPa and Category C sits below its 69 MPa threshold, so it is infinite life, while Category E is still finite at 1,669,000 cycles. Forever versus 1.67 million cycles, from the same weld.
- You control the category. Direction of stress, attachment length, grinding the toe or reinforcement flush, inspection level and keeping welds off the tension flange all move a detail up or down the A to E' ladder. A transverse CJP groove weld ground flush and radiographed is Category B; left as-welded it is Category C.
Ready to run your own beam? Open the free beam calculator, place your repeated load, read the moment, and divide by your section modulus to get your own nominal stress range to carry into the category table. No login is needed for the math. Building or studying? The full editor with a real FEM engine is free in the browser at the CalcSteel editor, and it is free for students through the CalcSteel education offer.
For a full worked example where fatigue actually chooses the member, read the sibling post Sizing a crane runway beam: the fatigue check that decides the section. This post classified the detail; that one sizes the beam once the detail is known.
Sources
- 1.ANSI/AISC 360-16, Specification for Structural Steel Buildings (Appendix 3, Design for Fatigue; Table A-3.1)
- 2.AISC Steel Construction Manual and Design Guides (fatigue detail categories, worked examples)
- 3.EN 1993-1-9, Eurocode 3, Part 1-9: Fatigue (detail categories, S-N curves)
- 4.C. G. Salmon, J. E. Johnson & F. A. Malhas, Steel Structures: Design and Behavior (Chapter 16, Fatigue)
- 5.ABNT NBR 8800, Projeto de estruturas de aço e mistas de aço e concreto de edifícios (fadiga)
Try CalcSteel for free
Model, analyze and design steel structures in your browser. No install, no signup.
Open the 3D editor