Engineering Stress and True Stress: the Criterion Behind the Code, With a Worked Check
Every fy and fu you look up is an engineering stress, force divided by the original area. The material actually carries a second, higher number: true stress, force divided by the area that is really there. Here is the difference, the conversion σtrue = σeng(1 + ε), why the code deliberately keeps the engineering value, and a worked check on a real L 100x100x10 tie where the CalcSteel engine puts the gap at 0.075% at service and 0.125% at first yield.
Key takeaways
- Engineering stress is P/A0 (original area); true stress is P/Ai (the instantaneous, real area). Below necking they are linked by σtrue = σeng(1 + ε) and εtrue = ln(1 + ε).
- The code writes fy and fu as engineering stresses because that is exactly what the tension test (ASTM E8, ISO 6892) reports: force over the original cross-section.
- At the strains design lives in, the two stresses agree to a rounding error: the CalcSteel engine puts a service tie at σ = 150.0 MPa, where true stress is only 0.075% higher.
- Worked L 100x100x10 tie (A = 19.0 cm2, N = 285 kN): the engine returns an elongation of 3.000 mm, matching NL/AE, so ε = 0.000750 and σtrue = 150.11 MPa.
- Push the same tie to N = 475 kN and the engine returns σ = 250.0 MPa = fy with a 5.000 mm stretch; true stress is 250.31 MPa, a 0.125% gap. The split only becomes real out at necking, where engineering stress falls to fracture while true stress climbs past 460 MPa.
The two stresses in every tension test, and the one the code keeps
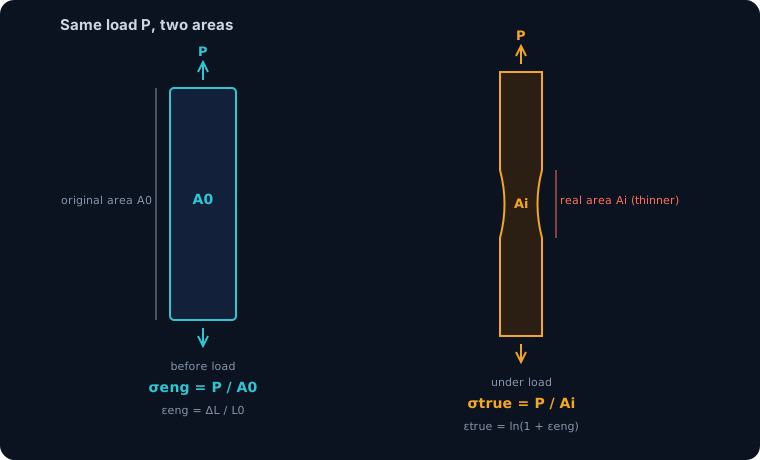
Pull a steel coupon apart and a testing machine records one force and one elongation at every instant. From that single pair of readings you can compute the stress two different ways, and both are correct. Divide the force by the original cross-section it started with and you get engineering stress, σeng = P/A0. Divide it by the actual cross-section at that moment, the area that has already thinned under load, and you get true stress, σtrue = P/Ai. Same force, two denominators, two numbers.
Every strength in your code, fy the yield strength and fu the ultimate strength, is the first one: an engineering stress. The material, meanwhile, is always feeling the second one. This article is about that gap: what it is, the one-line conversion between the two, why AISC, NBR 8800 and Eurocode all speak in engineering stress on purpose, and a worked check on a real steel tie where the CalcSteel FEM engine measures the gap to the fourth decimal. The short version is that the code chose the number it can measure, and it loses almost nothing by doing so, until you get out to necking, where the two stresses part company for good.
Engineering stress and true stress, defined
Here are the four definitions you can quote, all built from the same measured force P, original length L0 and original area A0.
- Engineering stress, σeng = P / A0. The load carried by every square millimetre the bar started with.
- Engineering strain, εeng = ΔL / L0. The stretch as a fraction of the original length.
- True stress, σtrue = P / Ai. The load over the instantaneous area Ai, which shrinks as the bar stretches (Poisson contraction elastically, then constant-volume flow plastically).
- True strain, εtrue = ln(Li / L0) = ln(1 + εeng). The sum of every incremental stretch dL/L, integrated over the deformation.
The distinction is invisible while the bar barely moves and grows as it deforms. In tension Ai is smaller than A0, so true stress is always the larger of the two. Engineering stress is a bookkeeping convenience anchored to the geometry you can measure with a caliper before the test; true stress is what the surviving material is actually resisting.
The conversion, and the assumption it rides on
The two descriptions are not independent; one line converts between them. As long as the deformation is uniform along the bar (that is, before any neck forms) and plastic flow conserves volume, AiLi = A0L0. Rearranging gives Ai = A0 / (1 + εeng), and therefore:
σtrue = σeng (1 + εeng) and εtrue = ln(1 + εeng)
Read the two conditions again, because they are the fine print engineers forget. The relation holds only while the section is uniform (so it dies the instant the bar necks) and only while volume is conserved (which is a good model for plastic flow, where Poisson's ratio is effectively 0.5, but not for the elastic range, where it is about 0.3 and the bar does change volume slightly). In the elastic design range the true correction is even smaller than σeng(1 + ε) suggests, so using the constant-volume form there is a mildly conservative, safe simplification. The table runs the conversion across the range that matters.
| Point on the curve | εeng | σeng (MPa) | σtrue (MPa) | Gap |
|---|---|---|---|---|
| Service tie (worked below) | 0.000750 | 150.0 | 150.11 | +0.075% |
| First yield, MR250 (fy = 250) | 0.001250 | 250.0 | 250.31 | +0.125% |
| First yield, A572-50 (fy = 345) | 0.001725 | 345.0 | 345.60 | +0.172% |
| At ultimate, mild steel (fu = 400) | 0.16 | 400.0 | 464.0 | +16.0% |
Three rows are a rounding error; the fourth is a different world. That contrast is the entire story of when the distinction matters.
Why the code is written in engineering stress
If true stress is what the material really carries, why does no design clause use it? Three reasons, and they compound.
1. It is what the test reports. The strengths in every steel standard come from a tension test run to a fixed procedure (ASTM A370, which invokes ASTM E8/E8M; ISO 6892-1 elsewhere). Those procedures define yield and tensile strength as force divided by the original cross-sectional area. fy and fu are engineering stresses by definition, not by choice; the code simply inherits the number the laboratory is required to report.
2. Design lives where the two agree. Every strength check, bending, axial, shear, the interaction equation, is a comparison at or below fy, so at strains under about 0.18%. As the table showed, true stress is under two tenths of a percent above engineering stress there. The code gains nothing by carrying a correction smaller than the scatter in the steel itself.
3. It is the conservative direction. Because true stress exceeds engineering stress in tension, the material's real yield point sits just above the tabulated fy. Designing to the engineering value leaves that sliver in reserve rather than spending it. A number that is directly measured, easy to tabulate, and slightly safe is exactly what a code wants.
At design strains, the two agree to a rounding error
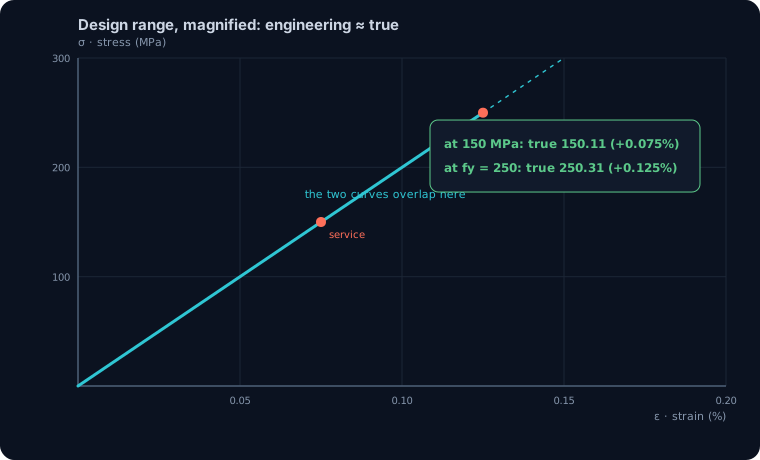
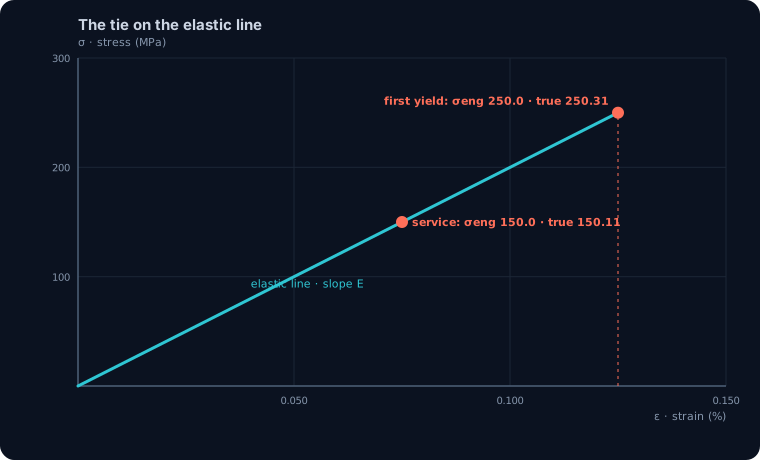
Zoom into the part of the curve a structural engineer ever operates in, from the origin up to yield, and the engineering and true lines are visually one line. At ε = 0.000750 the conversion adds 0.075%; at first yield for MR250, εy = 0.00125, it adds 0.125%; even for a 345 MPa grade at εy = 0.001725 it adds only 0.172%. On a plotted stress axis those offsets are thinner than the ink.
The elastic Poisson caveat makes the real gap smaller still. Below yield the bar has not started constant-volume plastic flow, so its area shrinks with Poisson's ratio 0.3, not 0.5. Carrying that correctly, the true stress at first yield is about 250.19 MPa rather than the 250.31 MPa the constant-volume formula returns, a 0.075% gap instead of 0.125%. Either way the message is the same: in the design range, engineering stress is true stress for every practical purpose, and the tidy σeng(1 + ε) form is the safe one to quote because it slightly overstates the gap. This is the deepest sense of the criterion behind the code: the code did not approximate anything, it worked in the regime where the approximation is exact to three decimals.
Where they split: ultimate strength and necking
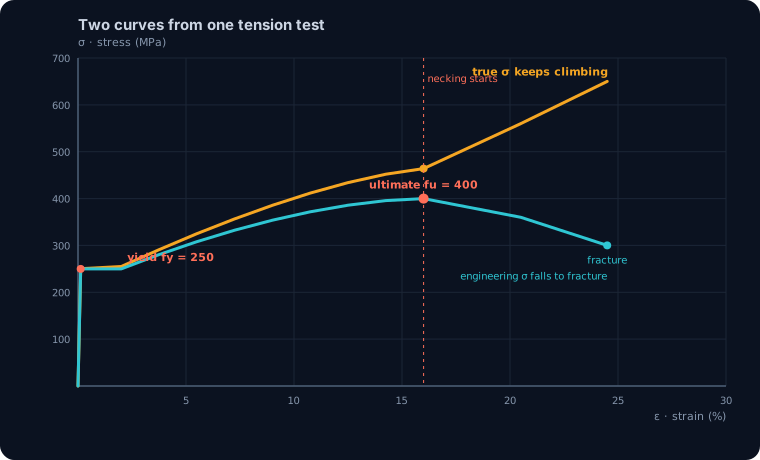
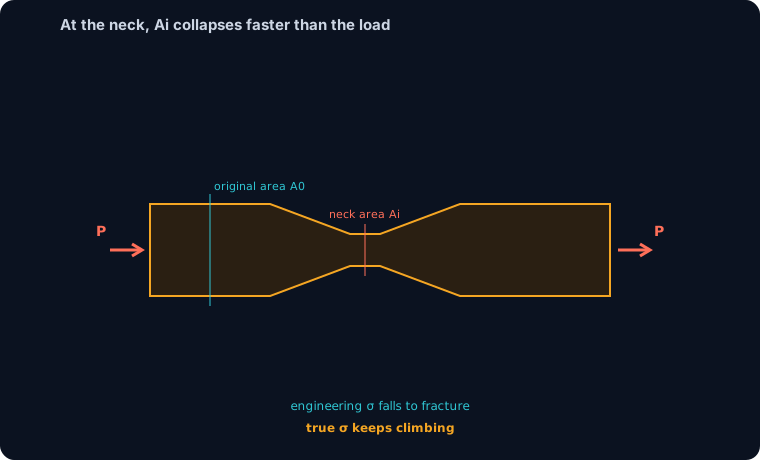
The distinction stops being academic exactly where uniform deformation stops: the neck. Up to the ultimate strength fu the whole gauge length stretches together, and σeng(1 + ε) still holds. For a mild steel that reaches fu = 400 MPa at a uniform strain of about 16%, true stress at that point is 400 x 1.16 = 464 MPa, already 16% above the engineering value, at a true strain of ln(1.16) = 0.148.
Past fu the two curves do opposite things, and it is worth being precise about why. Deformation localizes into a neck; the load the bar can carry starts to drop. Engineering stress, still dividing that falling load by the fixed original area A0, falls with it, sliding down to fracture at maybe 300 MPa. True stress divides the same falling load by the real area, which is collapsing faster than the load, so it keeps rising all the way to fracture, well past 600 MPa for a ductile structural steel. The engineering curve's famous downhill run to fracture is not the material getting weaker; it is an artefact of dividing by an area that is no longer there. The material never softens. That single insight, that the drop is a bookkeeping shadow of a shrinking cross-section, is why anyone studying fracture, forming or crash uses true stress and never engineering stress.
Worked check, part 1: a real L 100x100x10 tie
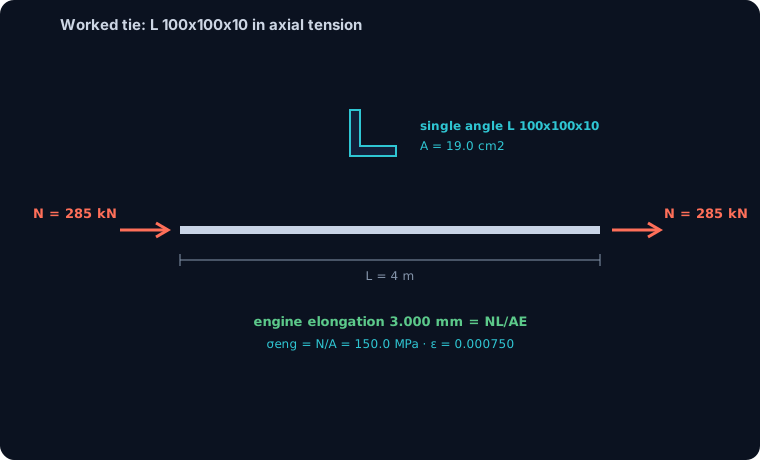
Time to measure the gap rather than assert it. Take the most honest possible test object for a stress this pure: a single-angle L 100x100x10 acting as a tension tie, a bracing member or hanger 4 m long in structural steel. An axial member has one stress, uniform over the section, exactly the coupon geometry the whole engineering-versus-true distinction was born on.
We model it in the CalcSteel FEM engine, the same solver behind the calculators, and read the results. Under a service tension of N = 285 kN the engine returns the axial force in the member as 285.0 kN (equilibrium, as it must) and reports the section area as A = 19.0 cm2. It also returns the elongation of the loaded end: 3.000 mm. That last number is the check on the engine itself, because closed-form N L / (A E) = 285 x 400 / (19.0 x 20000) = 0.300 cm = 3.000 mm, matching to the third decimal. The stiffness is right, so the stress and strain we pull from it are trustworthy.
Worked check, part 2: engineering vs true at the service load
Now turn the analysis into the two stresses. Engineering stress is the axial force over the original area: σeng = N / A0 = 285 kN / 19.0 cm2 = 15.0 kN/cm2 = 150.0 MPa. The strain the fibre is feeling is that stress over the modulus: ε = σ / E = 150.0 / 200000 = 0.000750, which is the same 0.075% the engine's 3.000 mm elongation over the 4000 mm length gives directly (3.000 / 4000 = 0.000750). Two independent routes, one strain.
True stress applies the conversion: σtrue = σeng(1 + ε) = 150.0 x 1.000750 = 150.11 MPa. The material is carrying 150.11 MPa; your analysis, your code check and your calculator all say 150.0 MPa. The gap is 0.11 MPa, or 0.075%, on a tie loaded to 60% of MR250's yield. This is not a coincidence of this member; it is the general fact that in the elastic range ε is a fraction of a percent, so (1 + ε) is one to three decimals. The utilisation your software prints, σ/fy = 150/250 = 0.60, would read 0.601 in true stress. Nobody sharpens a design on the third decimal of the utilisation, which is precisely why the code does not carry it.
See it yourself: read a stress, convert it
You can reproduce the whole exercise. In the calculator below, set up a member and a load and read the stress it reports. Divide that stress by 200,000 MPa and you have the strain ε. Multiply the stress by (1 + ε) and you have the true stress. You will watch the correction stay in the third or fourth decimal for anything short of yield, and you will see with your own numbers why the code keeps the engineering value.
It is the same engine that produced the worked tie above, free, with no login for the maths.
Max moment
45 kN·m
Max shear
30 kN
Max deflection
10.55 mm
= L/569
Bending stress σ
84.4 MPa
σ = M/Sx
Utilization
44.0%
NBR 8800 · δ ≤ L/250
Geometry & supports
Section
Ix 7999 cm⁴ · Sx 533 cm³ · 42.2 kg/m
Point loads (↓ positive)
None — add as many as you need.
Distributed loads (uniform or trapezoidal)
Model sketch
Diagrams — free PNG / SVG / CSV export, no watermark
Step-by-step — the calculation memory of YOUR beam
IPE 300 · L = 6 m · fy = 250 MPa
1. Reactions (equilibrium of the solved FEM model)
ΣFy = 0 · ΣM = 0
R_A = 30 kN · R_B = 30 kN
2. Peak shear (read from the SFD)
Vmax = |V(x)|max
Vmax = -30 kN @ x = 6 m
3. Peak moment (read from the BMD)
Mmax = |M(x)|max
Mmax = 45 kN·m @ x = 3 m
4. Peak deflection
EI = 15998 kN·m² (E = 200 GPa)
δmax = 10.55 mm @ x = 3 m = L/569
5. Elastic bending stress
σ = Mmax / Sx = 45.00 × 10³ / 533.3
σ = 84.4 MPa
6. Bending check — both codes, side by side
NBR 8800: σ ≤ fy/1.10 = 227.3 MPa · AISC 360: σ ≤ 0.90·fy = 225 MPa
NBR 37.1% PASS · AISC 37.5% PASS
7. Deflection check (serviceability — code-independent)
δ ≤ L/250 = 24 mm
10.55 mm / 24 mm = 44.0% PASS
Recomputed live from the current inputs by the direct-stiffness FEM engine — change any load and every step updates. Reproduce it by hand with the formulas in the sections below.
Lightest catalog profiles that pass (974 flexural candidates · NBR 8800)
| Profile | Std | Weight | Total steel | σ util | δ util | |
|---|---|---|---|---|---|---|
| W310x21 | AISC | 21 kg/m | 126 kg | 83% | 98% | |
| VS 300x23 | BR | 22.6 kg/m | 136 kg | 71% | 84% | |
| U 300x90x6.3 | BR | 23.1 kg/m | 139 kg | 82% | 98% | |
| U 300x100x6.3 | BR | 24.1 kg/m | 145 kg | 77% | 91% | |
| VS 250x25 | BR | 24.6 kg/m | 148 kg | 70% | 100% |
Elastic bending (σ = M/Sx vs fy/γa1, γa1 = 1.10 — NBR 8800) + deflection screening of the full flexural catalog. Lateral-torsional buckling, shear and local buckling are NOT checked here — run the full NBR 8800 / AISC 360 verification in the 3D editor.
Worked check, part 3: push the tie to yield
Raise the load until the tie first yields and watch the gap at the one point the code actually cares about. First yield in MR250 is σ = fy = 250 MPa, which needs N = 25 kN/cm2 x 19.0 cm2 = 475 kN. Re-run the same member at N = 475 kN and the engine returns σ = 250.0 MPa, an elongation of 5.000 mm (so ε = 5.000 / 4000 = 0.001250, exactly the yield strain of MR250), and the axial force back as 475.0 kN. Everything closes.
Convert: σtrue = 250.0 x 1.00125 = 250.31 MPa, and εtrue = ln(1.00125) = 0.0012492. At the yield point the code writes fy = 250 MPa; the material's true yield stress is 250.31 MPa; the difference is 0.31 MPa, three tenths of one percent, and in the safe direction. If the criterion behind the code is really a strain reaching a threshold, then the stress that names that threshold is the same number, 250 MPa, whether you measure it against the original area or the real one. The two definitions only diverge once you leave the elastic world entirely, and structural design never does.
Where you must switch to true stress
None of this means true stress is a curiosity. It is indispensable, just not in a member strength check. Reach for it, and never engineering stress, whenever the steel is deliberately taken into large plastic strain:
- Cold forming. Press-braking a plate or roll-forming a cold-formed section drives strains of 10% to 30% at the bend. The forming force, the springback and the residual stress all depend on the flow (true) stress at those strains; the engineering curve, already falling there, would mislead you badly.
- Finite-element modelling of ductile failure. Any nonlinear FE run that follows steel past yield, connection ductility, seismic fuses, blast, crash, must be fed a true stress versus true (or plastic) strain curve. Feeding a solver the engineering curve tells it the material softens after fu, which it does not, and the analysis diverges or lies.
- Fracture and low-cycle fatigue. Reduction of area, true fracture strain and the strain-life relations that govern seismic detailing are all written in true measures, because that is where the material's real state lives.
There is one place the two worlds meet inside the code, and it is worth naming. The minimum fu/fy ratio (roughly 1.1 to 1.25) and the minimum elongation that every structural grade must pass are engineering-stress requirements whose whole purpose is to guarantee a long plastic runway, the very region where true and engineering stress diverge. Plastic hinges, moment redistribution and seismic energy dissipation all spend that runway. So the code checks strength in engineering stress and buys ductility, measured the same way, to protect a plastic reserve it will describe in true stress the day it has to model it failing.
Common mistakes and FAQ
Thinking fu is the highest stress the steel ever reaches. fu is the peak of the engineering curve. The true stress at fracture is far higher, often 1.5 to 2 times fu, because the real area at the neck is a fraction of the original.
Reading the post-ultimate drop as the material weakening. The engineering curve falls after fu only because it divides a shrinking load by a fixed original area. The material strain-hardens right up to fracture; true stress never decreases.
Applying σtrue = σeng(1 + ε) after necking. The formula assumes uniform deformation and dies at the neck. Past that point the state is triaxial and localized, and true stress needs a direct area measurement (or a Bridgman correction), not the tidy conversion.
Feeding an engineering stress-strain curve to a nonlinear solver. A very common and dangerous error. Material models in FE expect true stress versus true (or plastic) strain; the engineering curve will make the model soften artificially past fu.
Is the difference ever significant in structural design? Not in a normal strength check: at and below yield it is under 0.2%. It becomes significant only in large-strain problems, forming, ductile fracture, crash, seismic detailing.
Which one does my calculator report? Engineering stress, always, because it computes force over the modelled (original) section. That is the right number to compare against a code fy or fu, which are engineering stresses too.
Does the same apply in compression? The sign flips: in compression the area grows, so true stress is slightly below engineering stress. At design strains it is again negligible, and compression is governed by buckling and stability well before the distinction could matter.
Key takeaways
Engineering stress is the number the code keeps because it is the number the test reports and the number design can use without a correction.
- σeng = P/A0, σtrue = P/Ai; before necking, σtrue = σeng(1 + ε) and εtrue = ln(1 + ε).
- fy and fu are engineering stresses by definition, because ASTM E8 and ISO 6892 report force over the original area.
- In the design range the gap is a rounding error: 0.075% at a service tie, 0.125% at first yield, and in the safe direction.
- Worked L 100x100x10 tie (A = 19.0 cm2, N = 285 kN): the engine gives a 3.000 mm stretch (= NL/AE), so σ = 150.0 MPa and σtrue = 150.11 MPa.
- At N = 475 kN the engine returns σ = 250.0 MPa = fy; the two stresses split for real only at necking, where engineering stress falls to fracture while true stress climbs past 460 MPa.
Sources
- 1.ASTM A370 / ASTM E8-E8M, Standard Test Methods for Tension Testing of Metallic Materials (strengths on the original cross-section)
- 2.ISO 6892-1, Metallic materials, Tensile testing at room temperature
- 3.AISC 360-16, Specification for Structural Steel Buildings (fy, fu and material properties)
- 4.Eurocode 3 (EN 1993-1-1) 3.2, Material properties
- 5.ABNT NBR 8800, Projeto de estruturas de aco e de estruturas mistas de aco e concreto
- 6.Dieter, Mechanical Metallurgy (true stress-strain, necking and the Bridgman correction)
Try CalcSteel for free
Model, analyze and design steel structures in your browser. No install, no signup.
Open the 3D editor